

A paper by Wiedemann, et al., funded and promoted by Meat and Livestock Australia, was recently published in the journal Agricultural Systems. [1] [2] It reported on the performance of Australia’s beef industry in relation to greenhouse gas emissions and its efficiency in terms of water use, fossil fuel energy demand and land occupation. This post focuses on greenhouse gas emissions.
The paper reported that the greenhouse gas emissions intensity of Australian beef production had reduced 14 percent between 1981 and 2010. The reported reduction was from 15.3 kg to 13.1 kg of CO2-equivalent greenhouse gases per kilogram of live weight (kg CO2-e/kg live weight). Emissions intensity is a measure of the kilograms of carbon dioxide equivalent (CO2-e) greenhouse gases per kilogram of end “product” (in this case the live animal).
Both of the reported figures are low relative to other studies. Although low figures and improvements over time are pleasing, the results may not be as positive as they seem.
Background
The Wiedemann paper was based on a life cycle assessment of Australian beef production, covering processes and inputs from “cradle to farm gate”, immediately prior to “processing”. It excluded beef from dairy cattle and the live export trade.
It is assumed dairy cattle were excluded due to the fact that their emissions are attributed to dairy products in addition to beef, which is a key reason for beef-related emissions from dairy cattle being far lower than those from the specialised beef herd.
The authors were not in a position to collect data on the final stages of live export animals.
Factors considered in the report
Emissions factors considered in the study included methane from enteric fermentation in the digestive system of ruminant animals; nitrous oxide and methane from manure management; carbon dioxide from fossil fuels; land clearing (deforestation) to promote pasture growth; and soil carbon losses from various sources.
Comparison with other emissions intensity assessments
Many assessments of greenhouse gas emissions intensity of food products have been conducted. In terms of Australian beef, perhaps the most recent reports suitable for comparison were published by the Food and Agriculture Organization of the United Nations (FAO) in November, 2013.
The FAO reports were based on findings from life cycle assessments using its Global Livestock Environmental Assessment Model (GLEAM). The model takes into account emissions along the supply chain to the retail point. It reported that “post-farm” emissions represented only 0.5 percent of beef’s global average emissions intensity. As those emissions were relatively minor, the FAO studies would seem to be a reasonable comparison with Wiedemann’s.
Although not specifically reporting on Australian beef, the FAO did report on Oceania, of which Australia and New Zealand are the major beef-producing nations. In 2010, Australia produced around 2.3 million tonnes of beef, with New Zealand’s output equivalent to just over a quarter of that figure. Excluding beef from the dairy herd (consistent with the Wiedemann study), New Zealand’s relative output may be significantly lower than indicated by those figures.
The FAO’s estimate of emissions intensity of specialised beef in Oceania was approximately 36 kg CO2-e/kg product (carcass weight), based on a 100-year GWP (refer below). [3] That was an overall figure based on animals from grazing and mixed feeding systems. The emissions intensity of beef from animals raised solely on grass would be far higher than that of animals raised on both grass and grain. (Although land clearing rates and related timing differences may account for some of the difference between the FAO’s Oceania figure and the Wiedemann study’s results, those land clearing rates are again increasing, as referred to below.)
The FAO’s global average figure for specialised beef was 67.6 kg, noting that feed digestibility, weight and age at slaughter, and the extent of land clearing are contributing factors. Its figure for beef from grass-fed animals was 102.2 kg, and from animals raised on a combination of grass and grain, 56.2 kg. [4] Those figures are based on a 100-year GWP and would be higher if a 20-year GWP had been utilised (as referred to below).
A 2003 “end use” report commissioned by the Australian Greenhouse Office (using a 100-year GWP) estimated an overall figure for Australian beef of 51.7 kg CO2-e/kg product for the 1999 reference period and up to 79.9 kg for earlier periods. [5]
Here’s a snapshot of the comparisons:
Figure 1: Comparative Emissions Intensities of Beef (showing relevant reference period)

Alternative methodologies would appear to account for some of the differences between Wiedemann’s findings and those from other reports, as Wiedemann and co-authors indicated a relatively low figure for each of their reference periods, being 1981 and 2010.
The approach to measuring emissions from enteric fermentation would almost certainly account for some of the difference. Enteric fermentation is the process that occurs in the digestive systems of ruminant animals, producing methane, an extremely potent greenhouse gas. For the northern cattle heard consuming tropical feed, the authors based their emissions intensity figure on a 2011 study by Kennedy and Charmley, who estimated methane emissions 30 percent lower than those used in the National Greenhouse Gas Inventory (NGGI). [6] That approach is likely to be adopted for the 2015 NGGI, reporting on 2013 emissions. [7]
However, alternative approaches to calculating methane’s impact are unlikely to account for the significant differences between the Wiedemann report and other analyses, as it represents thirty percent of one part (the northern cattle herd) of one factor (methane from enteric fermentation) amongst several.
Some concerns with the Wiedemann paper
Out of date “global warming potential” (GWP)
The emissions of different greenhouse gases can be aggregated by converting them to carbon dioxide equivalents (CO2-e). It is analogous to converting several different currencies to a common denomination. The greenhouse gases are converted by multiplying the mass of emissions by the appropriate “global warming potentials” (GWPs), which represent their warming effect relative to CO2. (For more details, please see my page GWP Explained.)
The GWP used by the paper’s authors for methane was already out of date when the paper was originally submitted to the journal for consideration in July 2014, and even further out of date when a revised version was submitted in November that year. The IPCC (Intergovernmental Panel on Climate Change) used a GWP multiplier of 25 in 2007 until it increased it to 34 (with climate-carbon feedbacks) and 28 (without those feedbacks) in its 2013 Fifth Assessment Report. [8] If updated methane and nitrous oxide figures (including climate-carbon feedbacks) had been used, beef’s emissions intensity would have been around 20 percent higher than reported, at 15.7 kg CO2-e/kg live weight.
Please also see comments below regarding a 20-year GWP.
Live weight versus carcass weight
The study is unusual to the extent that it bases its emissions intensity figures on live weight of the animal, rather than carcass weight or weight of the end product.
If we use the same adjustment factor for converting from live weight to carcass weight as was used in a report cited in the Wiedemann paper, then the emissions intensity would increase to 19.0 CO2-e/kg carcass weight. [9]
20-year GWP should also be considered
A time horizon of 100 years is commonly used in applying GWPs, and that was the case with this paper. That time horizon may not be appropriate when considering livestock’s climate change impacts, as methane breaks down to a significant extent within twelve years of being released.
In its Fifth Assessment Report, the Intergovernmental Panel on Climate Change (IPCC) acknowledged that the 100-year figure is not always appropriate by stating:
“There is no scientific argument for selecting 100 years compared with other choices. The choice of time horizon is a value judgement because it depends on the relative weight assigned to effects at different times.” [10]
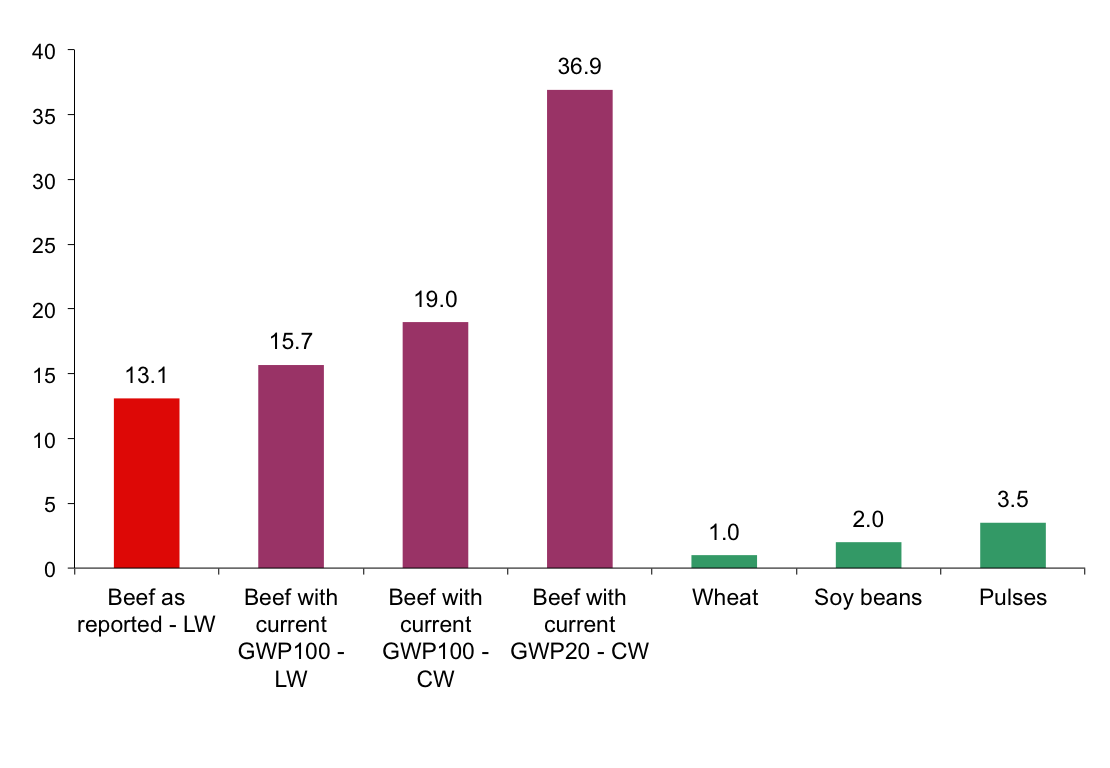
On the basis of carcass weight and a 20-year GWP for methane and nitrous oxide, the emissions intensity in this case would have been 36.9 kg CO2-e/kg live weight, without allowing for additional factors referred to below.
Figure 2: Alternative measures of beef’s emissions based on Wiedemann paper along with certain plant-based options
As another comparison, the FAO’s figures (referred to above) would increase as indicated below.
Figure 3: FAO Emissions Intensity figures GWP100 vs GWP20

The “20-year GWP” figures in Figures 2 and 3 are based on the global average percentage split of the various factors contributing to beef’s emissions intensity, and are intended to be approximations only. As methane’s percentage contribution would be lower in mixed systems than in grazing systems, the figure of 114.9 kg in Figure 3 may be overstated, while the figure of 208.9 kg may be understated.
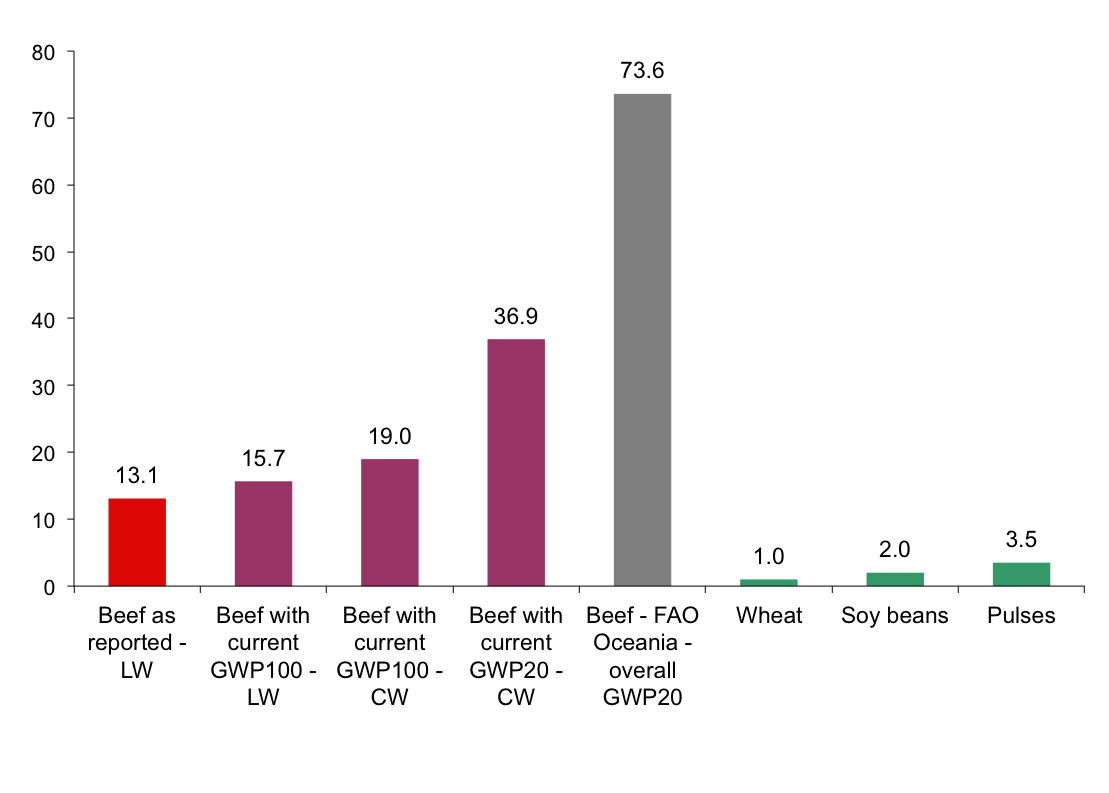
Allowing for the FAO’s estimate for Oceania (which is dominated by the Australian beef industry) gives us the following comparison with figures based on the Wiedemann study and some plant-based alternatives, as shown above.
Figure 4: Alternative measures of beef’s emissions based on Wiedemann paper and FAO along with certain plant-based options
Livestock-related land clearing is increasing
In promoting the Wiedemann paper, MLA reported that a reduction in emissions from land use “reflects the ban on broad scale clearing in Queensland”. [2] Unfortunately, due to exemptions and possible illegal clearing, livestock-related land clearing did not cease after the so-called ban (introduced by the previous Labor government) commenced in December, 2006.
In any event, the relevant legislation was overturned by the Liberal National government in 2013 in respect of land deemed to be of “high agricultural value”. [11] Even with the ban in place, extensive clearing for pasture occurred, including an estimated 134,000 hectares in 2011/12. [12]
The government changed to Labor again in early 2015, but it seems unwilling to revert to its earlier “ban”. The Minister for Natural Resources and Mines has said [13]:
“It is business as usual for landholders under Queensland’s vegetation management regulatory framework. I want to assure landholders and industry that current vegetation management practices remain in operation and there will be no rushed changes to the Vegetation Management Act 1999.”
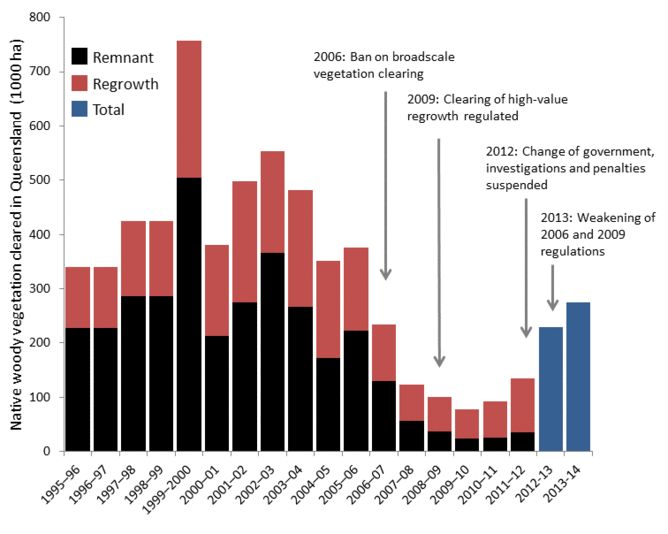
A forthcoming report from the Statewide Landcover and Trees Study (SLATS) is expected to indicate a figure of 275,000 hectares for 2013/14, which represents more than a tripling since 2009/10, when around 77,000 hectares were cleared. [14] [15]
Figure 5: Queensland land clearing 1995 – 2014
A report by the World Wildlife Fund has identified eastern Australia as one of eleven global “deforestation fronts” for the twenty years to 2030. It has stated: [16]
“A weakening of laws to control deforestation in Queensland and New South Wales could bring a resurgence of large-scale forest clearing, mainly for livestock farming.”
The Wiedemann paper allowed for average annual beef-related clearing of around 158,000 hectares in Queensland for the five years to 2010. That appears to be a reasonable estimate for that period, but may be understated in terms of future clearing.
The paper’s supplementary material (Table A12) indicated that over 8 million hectares (80,000 square kilometres) were cleared for beef production in Queensland from 1981 to 2010. (The figures shown in the table are the annual average per five-year period.)
The forests will always be at risk of further clearing, depending largely on the inclination of the government of the day. The recently signed free trade agreement with China may be a key factor in further acceleration of livestock-related land clearing.
Savanna burning omitted
The Wiedemann study ignores savanna burning in relation to livestock production, supporting the view expressed in the National Greenhouse Gas Inventory that the burning would occur naturally if not instigated by graziers. (The 2010 National Greenhouse Inventory attributed 10.8 percent of agriculture’s emissions to savanna burning.)
However, that position is not supported by climate change campaign group Beyond Zero Emissions and Melbourne Sustainable Society Institute (University of Melbourne), who have stated [17]:
“This position was based on largely anecdotal evidence that Aboriginal ‘firestick farming’ was extensively practiced prior to colonisation. Instead substantial expert opinion supports the conclusion that these emissions, categorised under Prescribed burning of Savannas, are anthropogenic. There is also evidence that savanna fires are far more widespread and frequent than would naturally occur.”
The Pew Charitable Trusts have also commented extensively on the destructive environmental impacts of livestock grazing, including manipulation of fire regimes (along with tree clearing, introduction of invasive pasture grasses, and degradation of land and natural water sources). [18]
Foregone sequestration omitted
The report’s authors did not consider foregone sequestration, despite the fact that livestock production has been responsible for around 70 percent of clearing in Australia. [19]. That is, they did not allow for the fact that current atmospheric carbon concentrations are far higher than they would have been if forest and other wooded vegetation had been retained, removing carbon from the atmosphere.
That approach is consistent with official emissions estimates, but they all contribute to society failing to clearly identify significant causes of climate change and relevant mitigation opportunities.
What many of us assume to be natural landscapes may be very different to what existed before livestock and other pressures were introduced. The problem is highlighted in the following words from Australia’s Commonwealth Scientific and Industrial Organisation [20]:
“It was once possible to walk from Melbourne to Sydney through almost continuous woodland cover, but now much of it is gone and the remaining patches are small and highly disturbed.”
Short-lived global warming agents omitted
Two warming agents generally omitted from official figures, and also from the Wiedemann paper, are tropospheric ozone and black carbon. They remain in the atmosphere for a short period, but have a significant impact.
Tropospheric ozone is formed through a series of chemical reactions involving nitrogen oxide, methane, carbon monoxide and other non-methane volatile organic compounds. It is the third most prevalent greenhouse gas after carbon dioxide and methane (not allowing for water vapour). Major sources of carbon monoxide are agricultural waste burning, savanna burning and deforestation.
In its fifth assessment report, the IPCC stated, “there is robust evidence that tropospheric ozone also has a detrimental impact on vegetation physiology, and therefore on its CO2 uptake”. [21]
Black carbon is a microscopic particulate that is formed through the incomplete combustion of fossil fuels, biofuels and biomass. The greatest single sources are savanna and forest fires, with livestock production playing a key role.
Black carbon contributes to global warming in two ways. Firstly, the particulates create heat by absorbing the sun’s radiation while airborne. Secondly, they can blow thousands of kilometres to land on glaciers and polar ice caps, where they cause solar radiation to be absorbed, rather than reflected, thereby speeding melting.
The Wiedemann paper’s approach on savanna burning, as referred to above, may be a factor in omitting the impact of tropospheric ozone and black carbon.
Soil carbon losses may be understated
The Wiedemann study considered loss of soil carbon arising from “cultivation for feed grain or fodder production, associated with land management and the conversion of pasture to crop land”.
Other relevant soil carbon emissions are not allowed for in official figures, and do not appear to have been considered in the Wiedemann paper.
Beyond Zero Emissions and Melbourne Sustainable Society Institute have highlighted the significant loss of soil carbon due to wind and water erosion that is “greatly accelerated by the removal and disturbance of vegetation”. They have reported that 80 percent of Australia’s soil organic carbon loss comes from rangeland grazing areas, highlighting the impact of rangeland deforestation and degradation. [22]
Conclusion
Despite the Wiedemann paper indicating relatively favourable results for Australian beef production’s greenhouse gas emissions, the material presented here indicates that beef’s performance is extremely poor (with emissions intensity figures more than ten times those of plant-based alternatives) after allowing for various additional factors. We must take those factors into account if we are to address the threat of climate change (including the essential mitigation measures) with the focus and urgency required.
Author
Paul Mahony (also on Twitter, Scribd, Slideshare and Viva la Vegan)
Note
The Wiedemann paper appears to contain two errors, which seem immaterial but may still be worth mentioning. Firstly, a reference of “DCCEE, 2010″ (the National Greenhouse Gas Inventory for 2008) was used on page 112, when it should have been “DCCEE 2012″ (the National Greenhouse Gas Inventory for 2010). Secondly, emissions from the beef herd were reported in gigagrams on page 113, when they should almost certainly have been megatonnes. (1 megatonne equals 1,000 gigagrams.)
Update 4th July, 2015
Comments on short-lived global warming agents and soil carbon losses added.
References
[1] Wiedemann, S.G, Henry, B.K., McGahan, E.J., Grant, T., Murphy, C.M., Niethe, G., “Resource use and greenhouse gas intensity of Australian beef production: 1981–2010″, Agricultural Systems, Volume 133, February 2015, Pages 109–118, http://www.sciencedirect.com/science/article/pii/S0308521X14001565 and http://ac.els-cdn.com/S0308521X14001565/1-s2.0-S0308521X14001565-main.pdf?_tid=e4c5d55e-fc16-11e4-97e1-00000aacb362&acdnat=1431813778_b7516f07332614cd8592935ec43d16fd
[2] Meat & Livestock Australia, “Australian beef industry reduces environmental footprint over 30 years”, 26th March 2015, http://www.mla.com.au/About-MLA/News-and-media/Media-releases/Australian-beef-industry-reduces-environmental-footprint-over-30-years and Target 100, “Australian beef and environmental impact: 30 years of progress and innovation” (© 2012 – 2014 Meat & Livestock Australia Limited), undated (accessed 29th June, 2015), http://www.target100.com.au/Hungry-for-Info/Target-100-Responds/Australian-beef-and-environmental-impact-30-years-of-progress-and-innovation
[3] Food and Agriculture Organization of the United Nations, “Greenhouse gas emissions from ruminant supply chains: A global life cycle assessment”, Figure 12, p. 30, Nov 2013, http://www.fao.org/ag/againfo/resources/en/publications/tackling_climate_change/index.htm; http://www.fao.org/docrep/018/i3461e/i3461e.pdf
[4] Food and Agriculture Organization of the United Nations, “Tackling climate change through livestock: A global assessment of emissions and mitigation opportunities”, Nov 2013, Table 5, p. 24, http://www.fao.org/ag/againfo/resources/en/publications/tackling_climate_change/index.htm; http://www.fao.org/docrep/018/i3437e/i3437e.pdf
[5] George Wilkenfeld & Associates Pty Ltd and Energy Strategies, “National Greenhouse Gas Inventory 1990, 1995, 1999, End Use Allocation of Emissions Report to the Australian Greenhouse Office, 2003, Volume 1″, Table S5, p. vii.
[6] Kennedy P. M., Charmley E. (2012) “Methane yields from Brahman cattle fed tropical grasses and legumes”, Animal Production Science 52, 225–239, http://dx.doi.org/10.1071/AN11103
[7] Australian National Greenhouse Accounts, National Inventory Report 2012, Volume 1, p. 275
[8] Myhre, G., D. Shindell, F.-M. Bréon, W. Collins, J. Fuglestvedt, J. Huang, D. Koch, J.-F. Lamarque, D. Lee, B. Mendoza, T. Nakajima, A. Robock, G. Stephens, T. Takemura and H. Zhang, 2013: “Anthropogenic and Natural Radiative Forcing. In: Climate Change 2013: The Physical Science Basis. Contribution of Working Group 1 to the Fifth Assessment Report of the Intergovernmental Panel on Climate Change” , Table 8.7, p. 714 [Stocker, T.F., D. Qin, G.-K. Plattner, M. Tignor, S.K. Allen, J. Boschung, A. Nauels, Y. Xia, V. Bex and P.M. Midgley (eds.)]. Cambridge University Press, Cambridge, United Kingdom and New York, NY, USA, http://www.ipcc.ch/report/ar5/wg1/
[9] Capper, J., 2011. The environmental impact of beef production in the United States: 1977 compared with 2007. J. Anim. Sci. 89 (12), 4249–4261. Cited in Wiedemman, et al., op cit.
[10] Myhre, G, op cit., p. 711-712
[11] Roberts, G, “Campbell Newman’s LNP bulldozing pre-election promise”, The Australian, 1 June, 2013, http://sunshinecoastbirds.blogspot.com.au/2013/06/campbell-newman-takes-axe-to-queensland.html
[12] Queensland Department of Science, Information Technology, Innovation and the Arts. 2014. Land cover change in Queensland 2011–12: a Statewide Landcover and Trees Study (SLATS) report. DSITIA, Brisbane, Table 4, p. 28, https://www.qld.gov.au/environment/land/vegetation/mapping/slats-reports/
[13] Queensland Government, Minister for State Development and Minister for Natural Resources and Mines, Media Statement, “Vegetation management business as usual”, 5th March 2015, http://statements.qld.gov.au/Statement/2015/3/5/vegetation-management-business-as-usual
[14] Maron, M., Laurance, W., Pressey, R., Catterall, C.P., Watson, J., Rhodes, J., “Land clearing in Queensland triples after policy ping pong”, The Conversation, 18th March, 2015 https://theconversation.com/land-clearing-in-queensland-triples-after-policy-ping-pong-38279
[15] Phelps, M., “Drought drives mulga hunger”, Queensland Country Life, 23rd February, 2015, http://www.queenslandcountrylife.com.au/news/agriculture/general/healthcare/drought-drives-mulga-hunger/2724451.aspx?storypage=0, cited in Maron, et al., op cit.
[16] World Wildlife Fund, “WWF Living Forests Report”, Chapter 5 and Chapter 5 Executive Summary, http://d2ouvy59p0dg6k.cloudfront.net/downloads/lfr_chapter_5_executive_summary_final.pdf; http://d2ouvy59p0dg6k.cloudfront.net/downloads/living_forests_report_chapter_5_1.pdf
[17] Beyond Zero Emissions and Melbourne Sustainable Society Institute of The University of Melbourne, “Zero Carbon Australia – Land Use: Agriculture and Forestry – Discussion Paper”, October, 2014, p. 90, http://bze.org.au/landuse
[18] Woinarski, J., Traill, B., Booth, C., “The Modern Outback: Nature, people, and the future of remote Australia”, The Pew Charitable Trusts, October 2014, p. 167-171 http://www.pewtrusts.org/en/research-and-analysis/reports/2014/10/the-modern-outback
[19] Derived from Russell, G. “The global food system and climate change – Part 1”, 9 Oct 2008, http://bravenewclimate.com/2008/10/09/the-global-food-system-and-climate-change-part-i/, which utilised: Dept. of Sustainability, Environment, Water, Population and Communities, State of the Environment Report 2006, Indicator: LD-01 The proportion and area of native vegetation and changes over time, March 2009; and ABS, 4613.0 “Australia’s Environment: Issues and Trends”, Jan 2010; and ABS 1301.0 Australian Year Book 2008, since updated for 2009-10, 16.13 Area of crops.
[20] Lindenmayer, D. and Burgman, M., “Practical Conservation Biology” (2005, CSIRO Publishing), p. 235, http://www.publish.csiro.au/onborrowedtime/docs/PCB_Ch09.pdf and http://www.publish.csiro.au/pid/5034.htm
[21] Myhre, G, et al., op cit., p. 661
[22] Beyond Zero Emissions and Melbourne Sustainable Society Institute of The University of Melbourne, op cit., pp. 47-48


[…] a review of an earlier paper by the same lead author paper and related promotional efforts of MLA, this […]