
Chatham House is a London-based “think tank”. Its website reports that it consistently ranks highly in the University of Pennsylvania’s annual “Global Go To Think Tank Index“, where it has been assessed by peers as the top think tank outside the US for seven consecutive years and number two worldwide for the past four years. [1]
In December, 2014, Chatham House released its research paper, “Livestock – Climate Change’s Forgotten Sector“. [2] The paper noted the livestock sector’s significant climate change impacts (which have been well documented by others) and the fact that major environmental groups and key decision makers are effectively ignoring that aspect of the climate crisis (a fact that has also been reasonably well documented).
The paper’s main contribution relative to previous reports was its reporting of results from a major survey it had commissioned into public attitudes on the relationship between climate change and meat and dairy consumption. The survey was conducted in Brazil, China, France, Germany, India, Italy, Japan, Poland, Russia, South Africa, the UK and the US.
Importantly, respondents in developing countries with growing meat consumption, China, India and Brazil, “demonstrated high levels of acceptance of anthropogenic climate change, greater consideration of climate change in their food choices, and a greater willingness to modify their consumption behaviour than the average of the countries assessed” (p. 23).
The authors suggest that, as more people become aware of the link between the livestock sector and climate change, they will modify their dietary habits. They also say that further research is required into methods that could be used to close the current “awareness gap”.
What are my concerns with the paper?
My comments focus on the climate change impact of the relevant products, which was the main focus of the paper. Other issues referred to were: health; food security; water security; land use; and biodiversity. [Footnote 1]
Overstatement of dairy’s emissions intensity relative to other products
Doesn’t meat from sheep and goats count?
The authors cited a November, 2013 report from the Food and Agriculture Organization of the United Nations (FAO) in stating that beef and dairy are the most emissions-intensive livestock products. [3] That is correct in respect of beef, but it does not reflect the FAO’s findings in respect of dairy. (The Chatham House paper used the term “dairy” to include milk from cows, sheep and goats, as well as eggs.) [4]
The FAO report was based on findings from life cycle assessments using its Global Livestock Environmental Assessment Model (GLEAM). The model takes into account emissions along the supply chain, from land use to the retail point.
Contrary to what is stated in the Chatham House report, the specific pages referred to in the FAO report (pp. 15-16) indicated that meat from small ruminant animals (sheep and goats) was more emissions-intensive than milk from those animals and cows. The measure of emissions intensity used at that point was kilograms of carbon dioxide equivalent greenhouse gases per kilogram of protein (kg CO2-e/kg protein).
Pork, chicken meat and chicken eggs (the only other products mentioned), were reported to be less emissions-intensive than milk (with chicken eggs having the lowest measure).
The results are summarised in Figure 1, showing approximate global average figures for each product. For comparison purposes, I have added protein-based emissions intensity figures for two plant-based products. They are mid-range figures from a 2012 paper by Nijdam, et al., which reported results from a range of life cycle assessment studies. [5]
Figure 1: Emissions intensity of various products (kg CO2-e/kg protein)
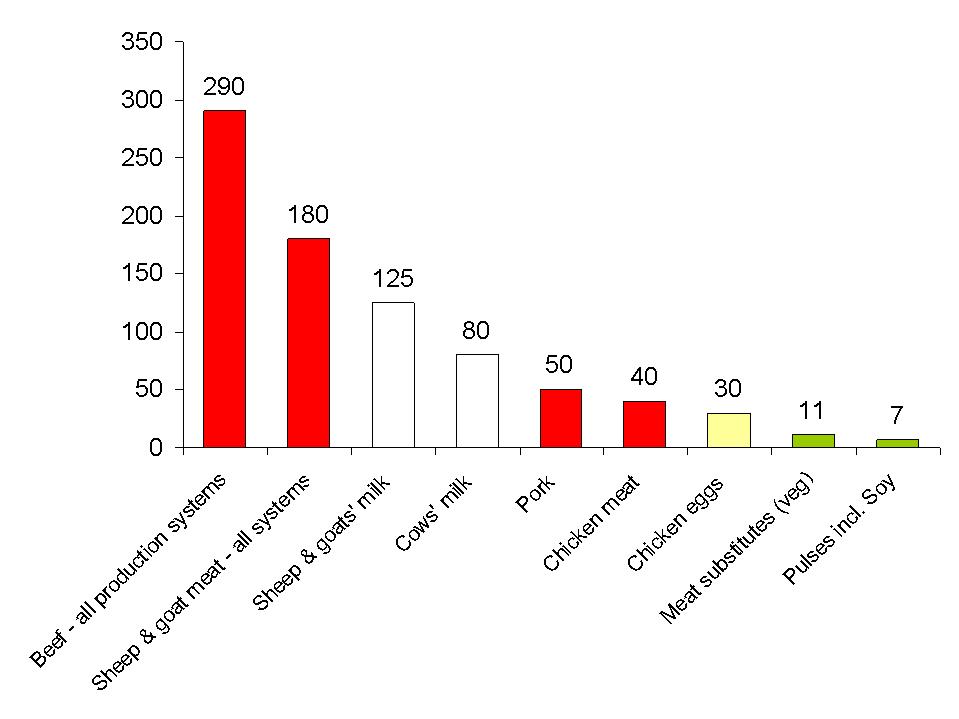
From FAO (global average for animal products) and Nijdam, et al. (mid-range for plant products)
What about alternative ways to measure emissions intensity?
Elsewhere in the cited report, the FAO used an alternative measure of emissions intensity; kilograms of carbon dioxide equivalent greenhouse gases per kilogram of product (kg CO2-e/kg product). Findings were provided in respect of products derived from cows, buffaloes, sheep, goats, pigs and chickens. Here are some of the results. For comparison purposes, I have added the product-based emissions intensity figure for pulses from Nijdam, et al.
Figure 2: Emissions Intensity of various products (kg CO2-e/kg product using 100-year GWP)

Based on 100-year GWP from FAO (global average for animal products) and Nijdam, et al. (mid-range for pulses)
It would have been helpful for the Chatham House authors to explain the emissions intensity basis that they had utilised, and to have also reported findings based on the alternative approach. Although emissions per unit of protein is a useful measure, the alternative takes into account the fact that nutrients other than protein also need to be considered. Such an approach has been widely utilised, with examples including: the FAO and Nijdam papers, along with a prominent study by Oxford University researchers (Scarborough, et al. as referred to below). [6]
Other conflicting results
The Chatham House authors mentioned that emissions vary greatly at farm level, national level, and across different production systems. To support that point, they cited the Nijdam paper (referred to above), yet that study also contradicted Chatham House’s point about dairy’s emissions intensity relative to other products.
Nijdam, et al. analysed fifty-two life cycle assessment studies dealing with a varying range of products, including meat, milk, seafood and other products. Twelve of the studies included milk. The authors did not specify any particular type of milk, and it would seem reasonable to assume they were referring to cow’s milk. In terms of the same measure referred to by Chatham House (emissions per kilogram of protein), Nijdam et al. reported that milk was less emissions intensive than sheep meat in all relevant studies.
Emissions intensity figures for milk were within the range of findings for pig meat, while the results for eggs were generally within or below that range. There was some overlap in the results for milk and eggs and those for poultry meat, seafood and certain meat substitutes. Results for the category “vegetal protein” were lower than those for milk in all cases, and generally lower than those for eggs.
Measured in terms of emissions per kilogram of product, Nijdam, et al.’s results were even more pronounced. The range of milk’s emissions intensity was found to be 1 – 2 kg CO2-e/kg product. That was a lower range than: beef; sheep meat; pork; poultry; eggs; and seafood. It was the same as 100% vegetable meat substitutes and pulses.
Other studies have found similar results. For example, the Oxford University study (Scarborough, et al.) referred to earlier, reported that milk’s emissions intensity was 1.8 kg CO2-e/kg product, which was significantly below that of eggs, fish, poultry, pig meat, sheep meat and beef. The emissions intensity of cream was also relatively low, at 2.4 kg CO2-e/kg product.
Scarborough, et al.’s paper was also referred to in the Chatham House paper, but not in relation to dairy products. Like the Nijdam paper, the Scarborough paper did not specify any particular type of milk. Once again, it seems reasonable to assume that it was referring to cow’s milk.
A key reason for milk’s relatively low emissions intensity is that it is produced for most of a dairy cow’s life. As a result, the dairy cow’s emissions are attributed to many more kilograms of product or protein, than those of a cow bred specifically for meat. The same point contributes to the fact that the emissions intensity of beef from dairy cows is lower than that of beef from cows bred specifically for meat. In other words, milk and meat from dairy cows are more efficient sources of nutrients than meat from specialised beef cattle, with inherent inefficiency being a key factor in the relatively high emissions intensity of many animal-based food products.
When measured in terms of emissions per kilogram of product, cheese is more emissions intensive than milk due to its relative density, in that the weight of the food consumed is less than the weight of the food that contributed to its production. Nijdam, et al. reported that cheese’s emissions intensity ranged from 6 to 22 kg CO2-e/kg product, meaning it was generally lower than that of sheep meat, which ranged from 10 to 150 kg CO2-e/kg product. [Footnote 2]
In terms of emissions per kilogram of protein, milk and cheese are similar, with ranges of 28-43 kg CO2-e/kg protein for milk and 28-68 kg CO2-e/kg protein for cheese. The reason is that most of the protein from the milk is retained in the end product.
The Chatham House authors were correct in highlighting the benefits of plant-based products in terms of greenhouse gas emissions per unit of protein. On that measure, despite dairy products figures being well below those of beef, Nijdam, et al. reported that they are significantly higher than products such as pulses, including soy, which were measured at 4-10 kg CO2-e/kg protein. When measured in terms of emissions per kilogram of product, the figure for pulses is identical to that of milk, at 1-2 kg CO2-e/kg product.
The Chatham House report has been widely reported, including its focus on dairy products. In absolute terms, dairy’s emissions are significant. However, that fact (at least in respect of milk) primarily reflects the high volume of product, rather than its emissions intensity. The emissions intensity of cow’s milk is generally a small fraction of beef’s, and more in line with many other products. For that reason, the decision by the Chatham House authors to categorise dairy, as a whole, with beef is difficult to understand.
Based on the evidence I have presented here, if individuals were to reduce their consumption of cows’ milk and certain other dairy products in an effort to reduce their carbon footprint, their efforts may be far less effective than a reduction in beef consumption.
No mention of Global Warming Potential (GWP)
The emissions intensity and overall emissions figures cited by the Chatham House authors were based on a 100-year “global warming potential” (GWP) for relevant greenhouse gases.
I argue that any paper highlighting the detrimental impact of animal agriculture should mention that a 20-year GWP may be a more appropriate measure. That’s because methane, a critical factor in livestock’s climate change impacts, breaks down in the atmosphere to a significant extent in 9-12 years. Accordingly, the standard 100-year GWP (which shows the average impact over a period of 100 years) greatly understates its shorter term impact. The alternative 20-year measure is readily available. The issue is critical when considering the impact of climate change tipping points, with potentially catastrophic and irreversible consequences.
In its Fifth Assessment Report, the Intergovernmental Panel on Climate Change (IPCC) acknowledged that the 100-year figure is not always appropriate. It stated, “There is no scientific argument for selecting 100 years compared with other choices. The choice of time horizon is a value judgement because it depends on the relative weight assigned to effects at different times.” [7]
To demonstrate the impact, I have converted Figure 2 above to a “20-year GWP” version. (Note the change of scale.) I have also grossed up relevant figures to represent emissions per kilogram of retail weight rather than carcass weight, as not all the carcass is used in the end product. [Footnote 3]
Figure 3: Emissions Intensity of various products (kg CO2-e/kg product using 20-year GWP and adjusted to retail weight)
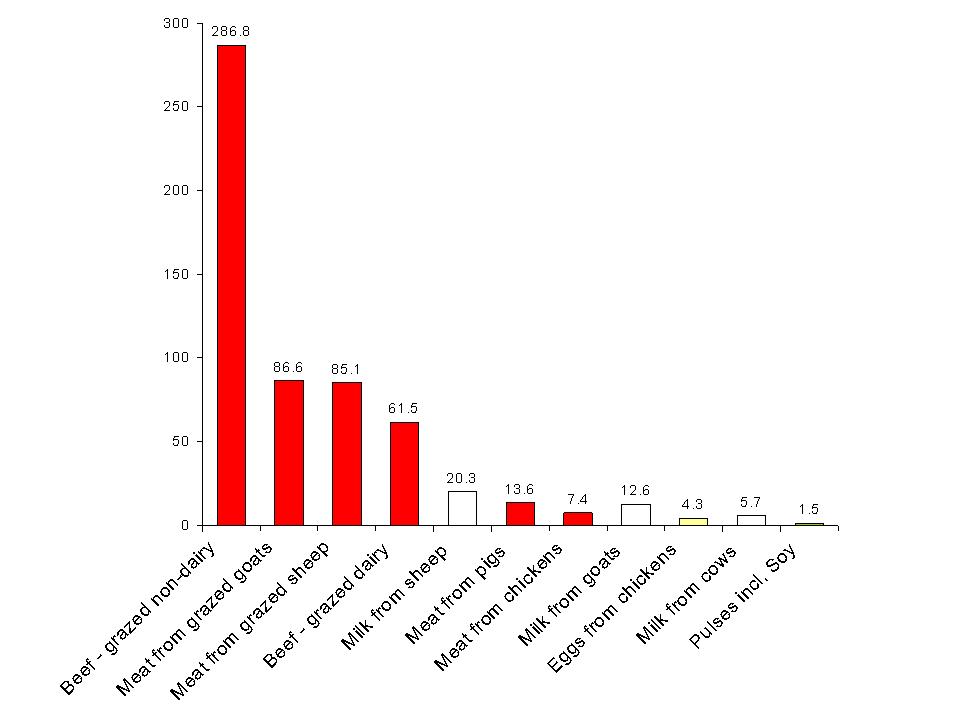
Based on 20-year GWP from FAO (global average for animal products) and Nijdam, et al. (mid-range for pulses) adjusted to 20-year GWP and retail weight
The figures are based on the FAO’s global average breakdown of the different greenhouse gases contributing to the relevant products’ emissions intensity. The figures for meat from grazed animals may be understated, because methane’s share of emissions in a grazing system would be higher than in a mixed system, and the methane figure is grossed up considerably when adjusting for a 20 year global warming potential. The emissions intensity figures vary significantly by region.
Acceptance of 2°C rise in temperature and the concept of a carbon budget
The Chatham House paper refers to “the stated objective of the international community” to avoid exceeding 2 degrees Celsius of global warming. It also notes the concept of a carbon budget, which is the difference between the total allowable greenhouse gas emissions for 2°C of warming, and the amount already emitted.
It is true that the 2°C threshold forms part of United Nations Framework Convention on Climate Change (UNFCCC), albeit with consideration toward lowering it to 1.5°C in the near future.[8]. Despite the potential lowering of the threshold, the 2°C figure appears to have become ingrained in climate change discourse. The concept of a carbon budget is also widely accepted. So, while the authors are not alone in helping to perpetuate these notions, as I have indicated elsewhere, both are likely to be disastrous. [9]
Leading climate scientist, Dr James Hansen, economist Jeffrey Sachs and co-authors have said that scenarios with 2°C or more global warming are so dangerous that “aiming for the 2°C pathway would be foolhardy”. [10]
In the latest IPCC Assessment Report, the lowest-risk carbon budget was based on a one-in-three chance of exceeding the 2°C threshold, that is to say, a one-in-three chance of failure. If the chance is lowered to one-in-ten, then based on an analysis by The Centre for Australian Weather and Climate Research, there is no carbon budget left. In other words, the carbon we have already emitted leaves us with a one-in-ten chance of exceeding 2°C above pre-industrial temperatures. [11] The current carbon budget concept allows for significant emissions beyond those that have already occurred.
We require a risk as low as one-in-a-million when building a jet airliner, but accept one-in-three chance of failure when trying to retain a habitable planet. The idea is bizarre, and ignores the fact that the climate crisis requires emergency action.
Conclusion
Although I perceive some shortcomings in the Chatham House paper, its survey results and the call for further research aimed at finding ways to change dietary habits for the benefit of the planet are welcome developments.
Author
Paul Mahony (also on Twitter, Scribd, Slideshare and Viva la Vegan)
Footnotes
1. I have not commented in detail on the paper’s reference to the livestock sector’s share of global greenhouse gas emissions, although my comments on GWP are relevant. For further comments on livestock’s share, please see my article “Livestock and climate: Do percentages matter?“.
2. Scarborough, et al. reported that 10.1 litres of milk are required to produce 1 kg of semi-hard cheese (Table 1). The FAO has reported that 1 litre of milk weighs 1.031 kg, therefore there are just over 10 kg of milk in 1 kg of cheese, with a corresponding impact on emissions intensity (in addition to emissions created in the production process). [12]
3. The figures for retail weight attribute all carcass weight emissions to retail cuts of meat. If emissions are also attributed to other products that may be derived from the carcass, utilising fat, bone and the like, then the emissions intensity of the retail cuts will be lower than shown here. For example, the highest figure (beef – grazed non dairy) would be around 208, rather than 287 kg CO2-e/kg product.
Updates
March 23, 2015: New Footnote 1 inserted.
April 5, 2015: Footnote 3 added.
References
[1] McGann, J.G., “2014 Global Go To Think Tank Index Report”, 4th February, 2015, University of Pennsylvania, http://repository.upenn.edu/cgi/viewcontent.cgi?article=1008&context=think_tanks
[2] Bailey, R., Froggatt, A., Wellesley, L., “Livestock – Climate Change’s Forgotten Sector: Global Public Opinion on Meat and Dairy Consumption”, Chatham House, The Royal Institute of International Affairs, December, 2014, http://www.chathamhouse.org/publication/livestock-%E2%80%93-climate-change%E2%80%99s-forgotten-sector-global-public-opinion-meat-and-dairy and http://www.chathamhouse.org/sites/files/chathamhouse/field/field_document/20141203LivestockClimateChangeBaileyFroggattWellesley.pdf
[3] Gerber, P.J., Steinfeld, H., Henderson, B., Mottet, A., Opio, C., Dijkman, J., Falcucci, A. & Tempio, G., 2013, “Tackling climate change through livestock – A global assessment of emissions and mitigation opportunities”, Food and Agriculture Organization of the United Nations (FAO), Rome, http://www.fao.org/ag/againfo/resources/en/publications/tackling_climate_change/index.htm
[4] Bailey, et al., op cit., Footnote 3, p. 4
[5] Nijdam, D., Rood, T., & Westhoek, H. (PBL Netherlands Environmental Assessment Agency), “The price of protein: Review of land use and carbon footprints from life cycle assessments of animal food products and their substitutes”, Food Policy, 37 (2012) 760–770, published online 26th September, 2012, http://www.sciencedirect.com/science/article/pii/S0306919212000942
[6] Scarborough, P., Appleby, P.N., Mizdrak, A., Briggs, A.D.M., Travis, R.C., Bradbury, K.E., & Key, T.J., “Dietary greenhouse gas emissions of meat-eaters, fish-eaters, vegetarians and vegans in the UK”, Climatic Change, DOI 10.1007/s10584-014-1169-1, 11th June, 2014, http://link.springer.com/article/10.1007%2Fs10584-014-1169-1
[7] Myhre, G., D. Shindell, F.-M. Bréon, W. Collins, J. Fuglestvedt, J. Huang, D. Koch, J.-F. Lamarque, D. Lee, B. Mendoza, T. Nakajima, A. Robock, G. Stephens, T. Takemura and H. Zhang, 2013: “Anthropogenic and Natural Radiative Forcing. In: Climate Change 2013: The Physical Science Basis. Contribution of Working Group 1 to the Fifth Assessment Report of the Intergovernmental Panel on Climate Change” , pp. 711-712, [Stocker, T.F., D. Qin, G.-K. Plattner, M. Tignor, S.K. Allen, J. Boschung, A. Nauels, Y. Xia, V. Bex and P.M. Midgley (eds.)]. Cambridge University Press, Cambridge, United Kingdom and New York, NY, USA, http://www.ipcc.ch/report/ar5/wg1/
[8] Cambridge University, “Climate Change: Action, Trends and Implications for Business, The IPCC’s Fifth Assessment Report, Working Group 1“, p.5, http://www.cisl.cam.ac.uk/Resources/Climate-and-Energy/Science-Report.aspam; http://www.europeanclimate.org/documents/IPCCWebGuide.pdf
[9] Mahony, P., “The climate crisis requires emergency action“, Terrastendo, 24th August, 2014, https://terrastendo.net/2014/08/24/the-climate-crisis-requires-emergency-action/
[10] Hansen J, Kharecha P, Sato M, Masson-Delmotte V, Ackerman F, Beerling, D.J., Hearty, P.J., Hoegh-Guldberg, O., Hsu, S, Parmesan, C., Rockstrom, J., Rohling, E.J., Sachs, J., Smith, P., Steffen, K., Van Susteren, L., von Schuckmann, K., Zachos, J.C. (2013) “Assessing ‘Dangerous Climate Change’: Required Reduction of Carbon Emissions to Protect Young People, Future Generations and Nature”. PLoS ONE 8(12): e81648. doi:10.1371/journal.pone.0081648, http://journals.plos.org/plosone/article?id=10.1371/journal.pone.0081648 and http://www.plosone.org/article/fetchObject.action?uri=info:doi/10.1371/journal.pone.0081648&representation=PDF
[11] Raupach, M. R., I.N. Harman and J.G. Canadell (2011) “Global climate goals for temperature, concentrations, emissions and cumulative emissions”, Report for the Department of Climate Change and Energy Efficiency. CAWCR Technical Report no. 42. Centre for Australian Weather and Climate Research, Melbourne, cited in Spratt, D., 22nd May, 2014, ibid., cited in Spratt, D., “The real budgetary emergency and the myth of “burnable carbon”, Climate Code Red, 22nd May, 2014, http://www.climatecodered.org/2014/05/the-real-budgetary-emergency-burnable.html
[12] Draaijer, J., “Milk producer resource book”, p. 40, Food & Agriculture Organization of the United Nations, 2002, http://www.fao.org/docrep/007/y3548e/y3548e06.htm and http://www.fao.org/docrep/007/y3548e/y3548e06.htm
Image
Cow,cattle, livestock © Visuall2 | Dreamstime.com

