

Bill McKibben, founder of US-based climate change campaign group 350.org, recently visited Australia for a series of presentations and media appearances. McKibben appears to have been extremely effective in mobilising people around the world, who are demanding meaningful action on climate change. The group’s mission statement states that 350.org is “building a global grassroots movement to solve the climate crisis”.
In his 2009 book, “Storms of my Grandchildren“, the former head of NASA’s Goddard Institute for Space Studies, Dr James Hansen, described how the organisation’s name came about [1]:
“In 2007, the environmentalist and writer Bill McKibben began bugging me, very politely, to either confirm 450 parts per million as the appropriate target level of carbon dioxide in the atmosphere or else to define a more appropriate one. He was developing a Web site to draw attention to this target limit and was thinking of calling it 450.org.”
Hansen eventually settled on a figure of 350. He and his colleagues explained the scientific basis for the number in a paper published in The Open Atmospheric Science Journal in 2008, titled “Target Atmospheric CO2: Where Should Humanity Aim?“. [2]
I attended McKibben’s Q&A session in Melbourne, and asked for his views on animal agriculture, given what I suggested were its massive impacts in relation to climate change.
McKibben’s main focus is fossil fuels, and I agree it’s essential that we deal with them. However, I also argue that we will not overcome climate change without a general move away from animal agriculture.
On the basis of McKibben’s response to my question and another question asked that day, along with the contents of his Orion Magazine article of 2 April, 2010 “The Only Way to Have a Cow“, I am concerned that he is dangerously under-estimating animal agriculture’s impact. [3]
Why do I use the word “dangerously”?
Firstly, because of the seriousness of the climate change crisis we are facing, which he understands very clearly.
Secondly, because McKibben has established a very large and loyal following, many of whom may readily accept what he says on most aspects of the issue.
The respect held for McKibben was epitomised by Melbourne academic, Robert Manne, at a presentation on the same day as the Q&A session. He told McKibben and the audience that there have been three names that stand out in the history of the climate movement: James Hansen; Al Gore; and Bill McKibben.
McKibben’s key focus in his responses and in the article were:
- animal agriculture’s share of greenhouse gas emissions
- grazing practices
- factory farming
- food miles
It seems that his position can be paraphrased as:
“If we want to reduce emissions from animal agriculture, we need to move away from factory farming, adopt a modified form of grazing, and buy locally.”
Let’s look at each of those issues.
1. Animal agriculture’s share of greenhouse gas emissions
1.1 Some Published Measures of Emissions: Goodland & Anhang and UN FAO’s “Livestock’s Long Shadow” Report
Purely as an example, I referred in my question to an article by Robert Goodland and Jeff Anhang in the November/December 2009 edition of World Watch Magazine, in which they estimated that livestock are responsible for around 51% of global greenhouse gas emissions. Goodland is a former lead environmental adviser to the World Bank, and Anhang is a research officer and environmental specialist at the World Bank’s International Finance Corporation. [4]
McKibben responded by refuting the suggestion of 51%, and saying that the correct figure is around 20%. He did not explain that view, but it may be based on the widely quoted estimate of 18% from the UN Food & Agriculture Organization’s (FAO) 2006 “Livestock’s Long Shadow” report. [5]
McKibben mentioned the 18% and 51% figures in his Orion Magazine article, referred to earlier.
In that article, McKibben stated that the “51%” study (presumably the Goodland and Anhang study but he provided no details) was “quickly discredited”. He did not support that claim with evidence.
Philanthropist and Microsoft co-founder, Bill Gates, seems to respect the Goodland and Anhang study, as he referred to it in calling for a move away from meat consumption in a “Mashable” blog post earlier this year. [6] Gates has also highlighted the issues on his own website. [7]
The FAO thought enough of the paper to invite Goodland to address its December, 2009 expert consultation on greenhouse gas emissions and mitigation potentials in the agriculture, forestry and fisheries sectors. [8]
Some may argue that the respiration issue (refer below) should not have been included by Goodland and Anhang. However, even if we were to remove that factor, the analysis would have indicated that livestock would be responsible for around 43% of emissions.
Goodland and Anhang highlighted many issues, which were reviewed in the context of “Livestock’s Long Shadow”. Two key issues were: (a) 20 year “global warming potential” (GWP) of methane; and (b) land use.
1.1.1 20-Year “Global Warming Potential” (GWP) of Methane:
If you’re not familiar with the GWP concept, you can find an explanation below. [9, 10, 11, 12] If you’d rather not read the details, the key point to note is that conventional measures of methane’s global warming impact measure it over a 100-year timeframe. However, methane breaks down in the atmosphere in around 12 years. That means the 100-year measure greatly understates its shorter-term impact, as it provides an average figure over a 100-year period, when the methane effectively did not exist during the final 88 years of that period.
Although methane may have a shorter life than carbon dioxide (which remains in the atmosphere for many hundreds of years), its impact can be long-term if it contributes to us reaching tipping points that result in positive feedback loops with potentially irreversible and catastrophic consequences. On the positive side, the relatively short-term nature of methane’s impact means that action on livestock production can be one of the most effective steps available to us in dealing with climate change.

The significance of methane in relation to livestock derives from the process of enteric fermentation, which causes the gas to be released through belching or burping. It is explained on the US Environment Protection Agency’s website [13]:
“Enteric fermentation is fermentation that takes place in the digestive systems of animals. In particular, ruminant animals (cattle, buffalo, sheep, goats, and camels) have a large ‘fore-stomach’ or rumen, within which microbial fermentation breaks down food into soluble products that can be utilized by the animal. Approximately 200 species and strains of microorganisms are present in the anaerobic rumen environment, although only a small portion, about 10 to 20 species, are believed to play an important role in ruminant digestion. The microbial fermentation that occurs in the rumen enables ruminant animals to digest coarse plant material that monogastric animals cannot digest. Methane is produced in the rumen by bacteria as a by-product of the fermentation process. This CH4 is exhaled or belched by the animal and accounts for the majority of emissions from ruminants. Methane also is produced in the large intestines of ruminants and is expelled.”
The U.S. Environmental Protection Agency has reported, “Globally, ruminant livestock produce about 80 million metric tons of methane annually, accounting for about 28% of global methane emissions from human-related activities.” [14]
Here’s the trend in global methane emissions over the past few decades [15]:
Figure 1: Global methane emissions

1.1.2 Land Use
Another critical issue is land use, including foregone sequestration on land previously cleared.
The report highlighted the fact that “Livestock’s Long Shadow” did not allow for foregone sequestration on land cleared in the years prior to the reporting period, although Goodland and Anhang did not fully incorporate the impact of such foregone sequestration, as referred to below.
Australia’s National Greenhouse Inventory, like most international measures, also does not allow for such foregone sequestration in any of its emissions figures.
Goodland and Anhang suggest the possibility of allowing land that has been cleared for livestock grazing or feed crop production to regenerate as forest, thereby mitigating “as much as half (or even more) of anthropogenic GHGs” [greenhouse gases]. Such an approach is consistent with studies from the PBL Netherlands Environmental Assessment Agency and the Centre for Alternative Technology in Wales (responsible for the Zero Carbon Britain 2030 plan), referred to in my article “Prince Charles on Climate Change and Deforestation“. [16]
Goodland and Anhang suggest that the land could, alternatively, be used to grow crops for direct human consumption or crops that could be converted to biofuels, thereby reducing our reliance on coal. They have used the biofuel scenario in their calculations, allowing for the greenhouse gas emissions from the coal that is continuing to be used in lieu of the biofuels.
1.1.3 Other Issues
Other issues referred to in Goodland and Anhang’s report:
- Livestock respiration overwhelming photosynthesis in absorbing carbon, due to the massive human-driven increase in livestock numbers.
- Increased livestock production since 2002.
- Corrections in documented under-counting.
- More up to date emissions figures.
- Corrections for use of Minnesota for source data.
- Re-alignment of sectoral information.
- Fluorocarbons for extended refrigeration.
- Cooking at higher temperature and for longer periods.
- Disposal of waste.
- Production, distribution and disposal of by-products and packaging.
- Carbon-intensive medical treatment of livestock-related illness.
1.2 Australian Emissions
For Australia, I reported in my article “Omissions of Emissions: A Critical Climate Change Issue” on the Department of Climate Change and Energy Efficiency’s figure of around 10% for animal agriculture’s share of emissions, comparing that to an estimate by campaign group Beyond Zero Emissions (BZE) of around 50%. [17] Additional factors considered by BZE relate to deforestation, grassland emissions and savanna burning, including the role of tropospheric ozone.
In that article, I argued that Australia’s official figures, in many respects, understate livestock’s true impact. The under-reporting has occurred because relevant factors are:
- omitted entirely from official figures, e.g. tropospheric ozone;
- classified under different headings, e.g. livestock-related land clearing reported under “land use, land use change and forestry” (LULUCF);
- considered but with conservative calculations, e.g. methane’s impact based on a 100-year, rather than 20-year, “global warming potential” (as referred to above).
It is clear that many factors can be taken into account when measuring the climate change impact of different sectors. I believe McKibben is wrong to effectively ignore valid alternatives to conventional measures of livestock’s impact. Particularly in relation to methane, it is difficult to understand why he would ignore as critical a factor as the 20-year global warming potential.
2. Grazing Practices
The second question at the Q&A session relating to animal agriculture referred to the March, 2013 TED presentation by Alan Savory, which was the subject of my article “Livestock and climate: Why Allan Savory is not a saviour“. [18]
In responding to my question, McKibben spoke favourably of Savory’s approach, and recommended that those at the session view the presentation.
I disagree with his views on that approach. In my view, Savory’s belief that we can achieve sustainable grazing practices on the scale needed to feed the masses is misguided. A move to such practices, along with a return to traditional farming practices and local food sourcing (referred to earlier), will not enable us to overcome catastrophic climate change, even if we also end our addiction to fossil fuels. (Information from James Hansen and colleagues on the critical role of reforestation can be found in section 2.6.)
Savory’s key claim is that livestock can be controlled through a planning process he called in the presentation “holistic management and planned grazing”, so as to be “a proxy for former herds and predators”, in trampling dry grass and leaving “dung, urine and litter or mulch”, enabling the soil to “absorb and hold rain, to store carbon, and to break down methane”.
He argues that we need to increase livestock production, rather than reduce it, in order to reverse desertification and overcome climate change.
In my “Savory is not a Saviour” article, I referred to (amongst other evidence) a study by Emma R.M. Archer of the University of Capetown, published in a 2004 edition of the Journal of Arid Environments, investigating the effect of commercial stock grazing practices on vegetation cover in an eastern Karoo study site in South Africa. Based on 14 years of satellite imaging data and objective assessment methods, the researchers reported that “holistic resource management” strategies of the type advocated by Savory resulted in lower levels of vegetation than more traditional approaches. [19]
I also referred to a study published in the journal Nature in 2005, indicating the massive potential for reforestation (as opposed to desertification) in Africa if livestock were removed and the related savanna burning ceased. [20]
McKibben’s comments at the presentation were consistent with those in his Orion Magazine article, in which he described a system that appeared to be Savory’s, although he did not provide a source for the information he presented.
Some key points in relation to these issues:
2.1 Animal Populations
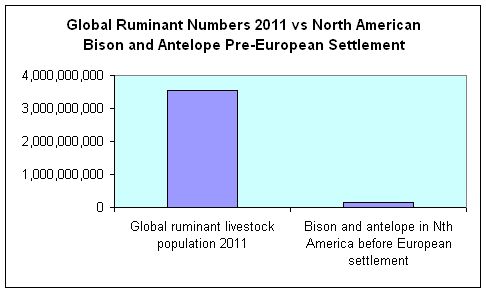
McKibben indicated at the presentation and in the article that large numbers of ungulate animals (hoofed mammals) had not caused problems in the past. However methane, nitrous oxide, carbon dioxide and other greenhouse gases do not respect national borders. Let’s consider global (as opposed to North American) animal populations.
More than 3.5 billion cows, sheep, goats, camels, other camelids and buffalo (which are all ruminants) are now kept at any one time as livestock globally, which is around 22 times the number of North American bison and antelope in earlier times, as referred to by McKibben. In just the fifty years to 2011, the combined number of such animals increased globally by around 1.15 billion, which itself is around seven times the number of McKibben’s bison and antelope. [21] [Footnote 2]
Figure 2: Number of Specified Animals
Australian researcher Geoff Russell has written of the massive increase in the number of animals since the year 1500, due to manipulation of breeding habits. Russell has stated:
“Wildlife rates of conception, growth, and the like don’t match what can be achieved by artificial selection, artificial insemination, good fences, irrigated feed production, predator extermination and all the other paraphernalia of modern agriculture. These have produced a totally unnatural and unprecedented explosion in numbers of those animals which people have designated as livestock.”
Russell’s table comparing global numbers from the year 1500 with those from 2004 can be seen below. [22]
Figure 3: Growing dominance of livestock biomass

2.2 Methane absorption
In supporting Savory’s intensive grazing practices, McKibben says:
” . . . recent preliminary research indicates that methane-loving bacteria in healthy soils will sequester more of the gas in a day than cows supported by the same area will emit in a year.”
He is assuming that Savory’s approach will result in healthier soils than would otherwise exist. That claim is incorrect in relation to large-scale agriculture. However, the key problem with the statement is that the preliminary research on which it appears to have been based was subsequently found to be subject to a critical and massive error.
As with most of McKibben’s arguments in the Q&A session and his Orion Magazine article, no studies or research were cited. However, the comparison used, and the timing of the article, make it likely that it was based on the work of Professor Mark Adams and colleagues from the University of Sydney.
On 3 September, 2009, an article by Matt Cawood was published in “The Land” and “The Australian Dairy Farmer“. The article stated that the research of Adams and his colleagues found that certain “high country soils oxidise methane at a rate of . . . 8,760 kilograms per hectare per year. . . . By contrast, 100 head of cattle produce about 5,400 kg/ha of methane a year”. [23, 24]
On the basis of those figures, a hectare of land in the Snowy Mountain region of Australia could support 162 head of cattle and be methane neutral. That figure is derived by dividing the amount of methane said to be absorbed by a hectare of land (8,760kg) by the methane emissions per cow (54kg). That is:
- 8,760kg/54kg = 162
The research was subsequently reported by Adam Sacks on the US environmental website Grist on 31 January, 2010. [25]
Sacks wrote, ” . . . one cow’s worth of healthy land actually absorbs one hundred times the methane emitted by that cow in any given year”.
Sacks also wrote: “The current orthodoxy tells us that because of digestive methane emissions, raising animals for food is a global warming problem, not solution. This is true given current practice: crowded feedlots with grain-fed, drugged cattle and manure lagoons on devastated lands, shipped long distances. “
That sounds very much like Bill McKibben (to repeat my paraphrase): “If we want to reduce emissions from animal agriculture, we need to move away from factory farming, adopt a modified form of grazing, and buy locally.”
In response to queries from Australian author and mathematician Geoff Russell (also referred to earlier), Sacks said that the source used for his article was an article in the Australian newspaper of 26 October, 2009, titled “A hiccup in the cow burp theory“. [26]
Sacks wrote, “A recent study points to oxidation of 8,760 kg per hectare per year – whereas a cow emits something in the neighborhood 54 kg per cow per year (i.e., 162 cows/hectare).”
Russell referred to the Grist and Australian articles in his article “Balancing carbon with smoke and mirrors” of 31 July, 2010 on the Brave New Climate website. He had been in touch with Professor Mark Adams, following which it seems the error in the calculations was discovered. [27]
A figure in micrograms had mistakenly been represented as milligrams within the calculations, meaning that the original “preliminary research” had overstated the relevant land’s methane absorption rate by a factor of 1,000. The result was that the high country soil’s methane oxidisation rate was only 8.76 kg per hectare per year, rather than 8,760 kg.
That hectare of land would not support 162 cows in a carbon neutral manner, but 0.162 of a cow. That is:
- 8.76kg/54kg = 0.162 (Corrected)
Matt Cawood reported the error in The Land on 16 July, 2010 [28]. He said, “Dr Robert Simpson, a post-doctoral research fellow who supplied the corrected values, said the methane oxidation rate measured by University researchers is actually 8.75 kilograms per hectare per year.”
The reference to a figure of 8,750kg in that article, compared to the original figure of 8,760kg, was not explained. However the difference is immaterial, and still generates a figure of 162 head of cattle per hectare.
Despite the error being discovered, the myth has lived on. As recently as 20th March, 2012, agricultural scientist Fiona Chambers said in a debate at a packed Melbourne Town Hall in Australia (commencing at around the 22 minute mark) [29]:
“Research undertaken recently at Sydney University has shown that just one hectare of pasture has enough potential for these methane-loving bacteria to actually extract methane out of the environment that could be produced by 162 head of cattle. Now that’s more than you could run on a hectare, so it makes it methane-neutral.”
The host organisation’s website confirms that Ms Chambers is a lecturer at Marcus Oldham Agricultural College in Geelong. She holds a Diploma of Applied Science in agriculture, specialising in animal health, nutrition and genetics and is undertaking a Master of Animal Breeding Management at Sydney University. [30]
At the end of the debate, the then Executive Director of climate change campaign group, Beyond Zero Emissions, Matthew Wright challenged Chambers on the veracity of the research by suggesting it had not been peer-reviewed. She confirmed that she had not seen a peer-reviewed journal article supporting the research. [31] However, the problems with the research went much further than Matthew Wright had indicated, as he did not refer to the massive over-statement of the soil’s methane absorbing capacity.
2.3 Manure Management
As referred to earlier, McKibben asked the following in relation to bison and antelope roaming across North America in earlier times:
“Why wasn’t their manure giving off great quantities of atmosphere-altering gas?”
Any soil’s supposed ability to absorb methane will have relatively little impact on overall greenhouse gas concentrations to the extent that those concentrations relate to gases emitted by manure. The first reason is that the amount of methane emitted by manure is very small compared to the amount emitted through enteric fermentation. For example, in Australia in 2011, emissions from manure management represented 3.9% of reported agricultural emissions, compared to enteric fermentation 65.1%. Methane represented just over half of the manure management emissions, with the balance being nitrous oxide. [32]
Emissions from agricultural soils (17.8%) and prescribed burning of savannas (12.3%) accounted for most of the remaining emissions. Animal agriculture has previously been reported to be responsible for nearly 60% of savanna-burning emissions. [33]
2.4 Fencing
McKibben suggests that the key technology in adopting alternative grazing practices is the single strand electric fence, for improved control of cattle. Here are some thoughts from Gerard Wedderburn-Bisshop on that issue from the TED website, in response to Allan Savory’s presentation:
“What Savory does not mention is that intensive (cell) grazing is only viable where water points are close and labour is cheap. Temporary or permanent fencing is labour intensive, moving herds daily requires far more labour input than most operations can afford.”
Wedderburn-Bisshop is a former Principal Scientist with the Queensland Government Department of Environment and Resources Management Remote Sensing Centre. He was responsible for assessing and monitoring vegetation cover, structure and trend across the state. This involved leading a team of remote sensing scientists to develop satellite monitoring methods to cover an area of 1.7 million square kilometres each year. He is currently a Director and Lead Scientist with the World Preservation Foundation and a researcher on Beyond Zero Emission’s Land Use Plan as part of its ZCA2020 project.
2.5 Native Grasslands and Mimicking Natural Processes
McKibben talks of “old-school ungulates” continually moving in order to avoid predators. He has stated that the grasslands they grazed “covered places that don’t get much rain”, including Australia. However, Australia “is the only continent other than Antarctica to NOT have native hoofed animals”, so those “old-school ungulates” did not exist there in the timeframe being considered by McKibben. [34]
In any event, his suggestion of “mimicking those systems with cows” is verging on the absurd when one considers the massive discrepancy between animal populations in earlier times and livestock numbers now, as referred to it item 2.1.
2.6 The critical role of reforestation and soil carbon
If we are to have any chance of reaching McKibben’s 350 ppm target, then we must objectively and realistically address the issues of reforestation and soil carbon. The essential role of those factors in achieving the target is demonstrated in this image from Hansen’s “Target Atmospheric CO2: Where Should Humanity Aim?” paper.
Figure 4: CO2 Emissions and Atmospheric Concentration with Coal Phaseout by 2030

By the time the 350 ppm target could be achieved with action on land clearing and soil carbon (around 2090 based on IPCC’s estimates of oil and gas reserves and assuming an end to non-sequestered coal use by 2030), it would fall short at around 380 ppm if we were to ignore those factors. If we did so, then the target would not be achieved until well beyond 2150.
To rely on an approach lacking scientific credibility, such as Allan Savory’s, would be a grossly irresponsible step at this critical point in the history of climate change.
[Please see Note 3 below, being a postscript regarding additional articles commenting on Allan Savory’s work.]
3. Factory Farming
In his Orion Magazine article, McKibben stated (with my bold highlights):
“Industrial livestock production is essentially indefensible—ethically, ecologically, and otherwise. We now use an enormous percentage of our arable land to grow corn that we feed to cows who stand in feedlots and eructate until they are slaughtered . . . We should simply stop eating factory-farmed meat and the effects on climate change would be but one of the many benefits.”
He refers to feedlots, with cattle fed on corn, along with cattle standing still “in big western federal allotments overgrazing the same tender grass”, as factory farming. He seems to ignore the impact of traditional grazing (including the related enteric fermentation) and grazing-related land-clearing and soil emissions. Those factors are related to (amongst others) the gross and inherent inefficiency of animals as a food source. For example, we currently use far more land due to grazing (and feed crop production) than would be the case if plant nutrition was accessed directly, rather than via the digestive systems of animals.
In Australia, feedlots represent only a small percentage of the beef industry. According to the Australian Lot Feeders Association, “The Australian beef feedlot industry plays a complementary role to the larger extensive grass fed cattle sector given that feedlot cattle spend 85-90% of their lives in a pasture based environment.” [35]
Despite the relatively small role of feedlots, as mentioned earlier and in my “Omissions of Emissions” article, the livestock sector is estimated by Beyond Zero Emissions to be responsible for around 50% of Australia’s total greenhouse gas emissions. That figure is significant for a country that, even using more conservative estimates of livestock’s impact, vies with the United States for the highest per capita emissions among developed nations.
Even in the United States, beef industry feedlots are generally only used for the final 3-5 months of an animal’s typical 15-24 month lifespan.
It is important to note that cattle emit considerably more methane when consuming grass than when consuming grain. Professor Gidon Eshel of Bard College, Annandale-on-Hudson, New York has reported, “since grazing animals eat mostly cellulose-rich roughage while their feedlot counterparts eat mostly simple sugars whose digestion requires no rumination, the grazing animals emit two to four times as much methane”. [36]
In 2007, writing in the medical journal The Lancet, a team of international health experts led by Australian National University professor Tony McMichael warned that the world’s growing appetite for meat was increasing greenhouse gas emissions as (amongst other problems) vast areas of rainforest were bulldozed for grazing land.
In its article on the Lancet report, The Age newspaper in Melbourne provided the following estimated breakdown of livestock-related greenhouse gas emissions [37]:
- Deforestation and desertification 35.4%
- Manure 30.5%
- Methane emissions, mainly burping 25.0%
- Artificial fertilisers 3.4%
- On-farm fossil fuel use 1.2%
- Other 3.6%
4. Food Miles
At the Melbourne Q&A session, McKibben said that one of the most important measures for reducing the climate change impact of animal agriculture was to buy locally. He said that when he is home, he tries to eat nothing produced outside the valley in which he lives.
In his Orion Magazine article, he referred to “the truck exhaust from shipping cows hither and yon”.
Is his concern over transportation vindicated by the evidence?
A comprehensive study of the emissions intensity of different food products in Sweden was undertaken by Annika Carlsson-Kanyama and Alejandro Gonzalez in 2009, and published in The American Journal of Clinical Nutrition. [38] The study authors are from the Division of Industrial Ecology, Royal Institute of Technology, Stockholm, Sweden, and the Research Institute on Biodiversity and Environment (Inibioma-Conicet), Bariloche, Argentina respectively.
Emissions intensity represents the kilograms of greenhouse gas emissions per kilogram of product.
The study included a wide range of foods, including legumes, fruit and vegetables, commodities which are often overlooked in reports on this subject. It included CO2-e emissions involved in farming, transportation, processing, retailing, storage and preparation.
A key point from the study was that beef is the least climate efficient way to produce protein, less efficient than vegetables that are not recognised for their high protein content, such as green beans and carrots. Its emissions intensity (“Beef: domestic, fresh, cooked”) is 30, as shown in the following chart, which compares it to various other products:
Figure 5: Emissions Intensity of specified food products

As a comparison, in 2003, the Australian Greenhouse Office reported a figure of 51.7kg for beef [39]. That figure was based on carcass weight. As only around 55% of a carcass is used for meat, the figure for beef based on a kilogram of served meat at that time would have been approximately 94 kg. The level of livestock-related land clearing has since reduced. Taking those factors into account, the Carbon Neutral group in Perth, Western Australia, has more recently estimated an emissions intensity figure for beef of 30.9.
Further comparisons are as follows, along with beef for ease of reference (with reference numbers in brackets):
Wheat and other grains: 0.4 [39]
Fruit and vegetables: 0.48855 [40]
Potatoes (Domestic, cooked): 0.45 [38]
Rice (Cooked): 1.3 [38]
Soy beans (Transported by boat and cooked): 0.92 [38]
Beef (Domestic, fresh, cooked): 30 [38]
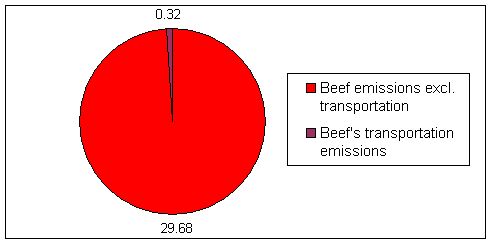
So what is the contribution of transport to a product’s greenhouse gas emissions? Here’s what Carlsson-Kanyama and Gonzalez said on that matter:
“ . . . to obtain emissions at Swedish household consumption level, the emissions from transport, packing, storage, retailing, and cooking are added considering their corresponding losses in the food chain. For example, land and sea transport accounts for 0.32 kg CO2/kg soy when transport overseas is included.”
The transportation component will be determined generally by weight, so its contribution should be the same for a kilogram of beef as for a kilogram of soy. In this case, unlike soy, there appears to be no sea transport involved in the beef figure. In the absence of a more precise figure, let’s assume that beef’s transport-related emissions per kilogram of product are the same as those of soy, even though they are likely to be less.
On that basis, of beef’s 30kg of emissions, around 0.32kg (1.1%) comes from transportation.
Figure 6: Beef’s emissions intensity including transportation (kg)
Air transportation adds considerably to the emissions intensity of a product, but that was not a factor in the beef referred to in the Swedish study. The following extracts deal with that issue, and add further light on the extremely favourable results for plant products.
“For vegetables and fruits, emissions usually are less than or equal to 2.5 kg CO2 equivalents/kg product, even if there is a high degree of processing and substantial transportation. Products transported by plane are an exception because emissions may be as large as for certain meats.”
“Emissions from foods rich in carbohydrates, such as potatoes, pasta, and wheat, are less than 1.1 kg/kg edible food.”
“Plant foods based on vegetables, cereals, and legumes present the lowest GHG [greenhouse gas] emissions with the exception of those transported by airplanes.”
“Animal products, including dairy, are associated with higher GHG emissions than plant-based products, with the highest emissions occurring in meats from ruminants.”
On the basis of these findings, McKibben’s concerns over transportation are ill-founded relative to what seems to be a lack of concern over certain other aspects of animal agriculture’s impact.
Another Issue: Health
McKibben said in his Orion Magazine article: “Oh, and grass-fed beef is apparently much better for you – full of Omega 3s, like sardines that moo.”
Whether it comes from grass-fed or grain-fed cows, beef is responsible for serious health problems. My article “If you think it’s healthy to eat animals, perhaps you should think again” reported on the links between consumption of animals and cancer, heart disease, diabetes and other ailments, as documented by the likes of Harvard University, Cornell University, The World Cancer Research Fund and The National Cancer Institute. Red meat featured prominently in the findings. [41]
Conclusion
Without focussing on animal agriculture in addition to fossil fuels and other contributors to climate change, we will not overcome the crisis that we have created. Bill McKibben, like other prominent climate change campaigners, must not ignore what may be the most inconvenient truth of all.
Notes:
1. None of the information in this article is intended to represent health, medical, dietary, nutritional or similar advice.
2. Bill McKibben’s tour of Australia was part of his “Do the Math” campaign. For Australian audiences, the local term “Maths” was used.
3. Postscript 14th August, 2013: Two additional articles commenting on Allan Savory’s work have come from Robert Goodland (referred to above) and James McWilliams. Goodland’s article is “Meat, Lies & Videotape (a Deeply Flawed TED Talk)” from Planetsave, 26th March, 2013, while McWilliams has written “All Sizzle and No Steak: Why Allan Savory’s TED talk about how cattle can reverse global warming is dead wrong“, published on Slate, 22nd April, 2013. Included in the McWilliams article are these comments about algal growth and desertification, a key aspect of Savory’s TED presentation: “Further weakening Savory’s argument for the wholesale application of holistic management to the world’s deserts is his distorted view of desert ecology. There are two basic kinds of deserts: genuinely degraded landscapes in need of revival and ecologically thriving ones best left alone. Proof that Savory fails to grasp this basic distinction comes when, during his talk, he calls desert algae crust (aka “cryptobiotic crust”) a “cancer of desertification” that represses grasses and precipitate runoff. The thing is desert algae crust, as desert ecologists will attest, is no cancer. Instead, it’s the lush hallmark of what Ralph Maughan, director of the Western Watersheds Project, calls ‘a complete and ancient ecosystem‘. According to the U.S. Geological Survey, ‘Crusts generally cover all soil spaces not occupied by green plants. In many areas, they comprise over 70 percent of the living ground cover and are key in reducing erosion, increasing water retention, and increasing soil fertility’. Savory, whose idea of a healthy ecosystem is one with plenty of grass to feed cattle, neglects the less obvious flora – such as, in addition to algae crust, blackbrush, agaves, and creosote – that cattle tend to trample, thereby reducing the desert’s natural ability to sequester carbon on its own terms. ‘It is very important,’ Maughan writes, ‘that this carbon storage not be squandered trying to produce livestock.'”
4. Postscript 1st February, 2014: Another article criticising Allan Savory’s TED presentation was published on the Real Climate website on 4th November, 2013. Real Climate “is a commentary site on climate science by working climate scientists for the interested public and journalists.” The article, from ecosystem scientists Jason West and David Briske and titled “Cows, Carbon and the Anthropocene: Commentary on Savory TED Video“, stated: “It is important to recognize that Mr. Savory’s grazing method, broadly known as holistic management, has been controversial for decades. . . . We focus here on the most dramatic claim that Mr. Savory made regarding the reversal of climate change through holistic management of grasslands. . . . While it is understandable to want to believe that such a dramatic outcome is possible, science tells us that this claim is simply not reasonable. The massive, ongoing additions of carbon to the atmosphere from human activity far exceed the carbon storage capacity of global grasslands.” (This note was added as a postscript to my article “Livestock and climate: Why Allan Savory is not a saviour“ on 26th December, 2013.)
Blog Author: Paul Mahony (also on Twitter, Slideshare and Sribd)
Main Image: Poppy and Jarrah hold a 350 kick-board at the Great Barrier Reef | 350.org
Footnote 1 re Main Image: Increasing CO2 concentrations are adversely affecting coral reefs due to warming ocean temperatures and ocean acidification. Cattle grazing is also affecting the Great Barrier Reef off Queensland, Australia.
The journal Water Science and Technology has reported on the impact of run-off from areas used for cattle grazing to the Great Barrier Reef Marine Park (GBRMP) [42]:
“Grazing of cattle for beef production is the largest single land use on the catchment with cropping, mainly of sugarcane, and urban/residential development considerably less in areal extent. Beef cattle numbers are approximately 4,500,000, with the highest stock numbers in the Fitzroy catchment.”
“Beef grazing on the large, dry catchments adjacent to the GBRMP (in particular the Burdekin and Fitzroy catchments) has involved extensive tree clearance and over-grazing during drought conditions. As a result, widespread soil erosion and the export of the eroded material into the GBR has occurred, and is continuing.”
Footnote 2: Various biomass figures have been removed due to difficulties in establishing accuracy.
References:
[1] Hansen, J. “Storms of my Grandchildren”, Bloomsbury, 2009, p. 140, http://www.bloomsbury.com/us/storms-of-my-grandchildren-9781608192571/
[2] Hansen, J; Sato, M; Kharecha, P; Beerling, D; Berner, R; Masson-Delmotte, V; Pagani, M; Raymo, M; Royer, D.L.; and Zachos, J.C. “Target Atmospheric CO2: Where Should Humanity Aim?”, 2008. http://www.columbia.edu/~jeh1/2008/TargetCO2_20080407.pdf
[3] McKibben, Bill, “The only way to have a cow”, Orion Magazine, Mar/Apr 2010, http://www.orionmagazine.org/index.php/articles/article/5339/
[4] Goodland, R & Anhang, J, “Livestock and Climate Change – What if the key actors in climate change are cows, pigs, and chickens?”, World Watch, Nov/Dec, 2009, pp 10-19, http://www.worldwatch.org/files /pdf/Livestock%20and%20Climate%20Change.pdf
[5] Food and Agriculture Organization of the United Nations, 2006 “Livestock’s Long Shadow – Environmental Issues and Concerns”, Rome
[6] Gates, Bill, “Food is Ripe for Innovation”, Mashable, 22 Mar 2013, http://mashable.com/2013/03/21/bill-gates-future-of-food/
[7] Gate, Bill, “The Future of Food”, The Gates Notes, undated, http://www.thegatesnotes.com/Features/Future-of-Food
[8] Goodland, R., “Forests, Fisheries, Agriculture: A Vision for Sustainability”, presented to UN FAO Expert consultation on greenhouse gas emissions and mitigation potentials in the agriculture, forestry and fisheries sectors, 2-4 Dec 2009, http://awellfedworld.org/sites/awellfedworld.org/files/pdf/FAOConsult12-09.pdf
[9] IPCC, TS.2.5 Net Global Radiative Forcing, Global Warming Potentials and Patterns of Forcing, http://www.ipcc.ch/publications_and_data/ar4/wg1/en/tssts-2-5.html
[10] FAO Newsroom, “Livestock a major threat to environment”, 29 November, 2006, http://www.fao.org/newsroom/en/news/2006/1000448/
[11] Sanderson, K, “Aerosols make methane more potent”, Nature, Published online 29 October 2009, doi:10.1038/news.2009.1049; http://www.nature.com/news/2009/091029/full/news.2009.1049.html
[12] Enteric Fermentation – Greenhouse Gases, http://www.epa.gov/ttnchie1/ap42/ch14/final/c14s04.pdf
[13] Schindell, D.T.; Faluvegi, G.; Koch, D.M.; Schmidt, G.A.; Unger, N.; Bauer, S.E. “Improved Attribution of Climate Forcing to Emissions”, Science, 30 October 2009; Vol. 326 no. 5953 pp. 716-718; DOI: 10.1126/science.1174760, http://www.sciencemag.org/content/326/5953/716.figures-only
[14] U.S. Environmental Protection Agency, “Ruminant Livestock”, http://www.epa.gov/rlep/faq.html#1
[15] National Oceanic and Atmospheric Administration, “The NOAA Annual Greenhouse Gas Index (AGGI)”, updated summer 2012, http://www.esrl.noaa.gov/gmd/aggi/
[16] Mahony, P., “Prince Charles on Climate Change and Deforestation”, Terrastendo, 11 May 2013, https://terrastendo.net/2013/05/11/prince-charles-on-climate-change-and-deforestation/
[17] Mahony, P., “Omissions of Emissions: A Critical Climate Change Issue”, Terrastendo, 9 Feb, 2013, https://terrastendo.net/2013/02/09/omissions-of-emissions-a-critical-climate-change-issue/
[18] Mahony, P., “Livestock and climate: Why Allan Savory is not a saviour”, 26 Mar, 2013, https://terrastendo.net/2013/03/26/livestock-and-climate-why-allan-savory-is-not-a-saviour/
[19] Archer, E.R.M., Journal of Arid Environments, Volume 57, Issue 3, May 2004, Pages 381–408, “Beyond the ‘climate versus grazing’ impasse: using remote sensing to investigate the effects of grazing system choice on vegetation cover in the eastern Karoo“, http://www.sciencedirect.com/science/article/pii/S0140196303001071
[20] Mahesh Sankaran, Niall P. Hanan, Robert J. Scholes, Jayashree Ratnam, David J. Augustine, Brian S. Cade, Jacques Gignoux, Steven I. Higgins, Xavier Le Roux, Fulco Ludwig, Jonas Ardo, Feetham Banyikwa, Andries Bronn, Gabriela Bucini, Kelly K. Caylor, Michael B. Coughenour, Alioune Diouf, Wellington Ekaya, Christie J. Feral, Edmund C. February, Peter G. H. Frost, Pierre Hiernaux, Halszka Hrabar, Kristine L. Metzger, Herbert H. T. Prins, Susan Ringrose, William Sea, Jörg Tews, Jeff Worden1 & Nick Zambatis, “Determinants of woody cover in African savannas”, Nature 438, 846-849 (8 December 2005) | doi:10.1038/nature04070; Received 26 April 2005; Accepted 22 July 2005, http://www.nature.com/nature/journal/v438/n7069/full/nature04070.html
[21] FAOSTAT, http://faostat.fao.org/site/573/default.aspx#ancor
[22] Russel, G. “Forget the quality, it’s the 700 million tonnes which counts“, 17 Nov 2009, http://bravenewclimate.com/2009/11/17/700-million-from-livestock/, citing Subak, S., “GEC-1994-06 : Methane from the House of Tudor and the Ming Dynasty“, CSERGE Working Paper, http://www.cserge.ac.uk/sites/default/files/gec_1994_06.pdf and Thorpe, A. “Enteric fermentation and ruminant eructation: the role (and control?) of methane in the climate change debate“, Climatic Change, April 2009, Volume 93, Issue 3-4, pp 407-431, http://link.springer.com/article/10.1007%2Fs10584-008-9506-x
[23] Cawood, M., “ETS lifeline: soils capable of absorbing cattle methane”, The Land, 3 Sep 2009, http://www.theland.com.au/news/agriculture/agribusiness/general-news/ets-lifeline-soils-capable-of-absorbing-cattle-methane/1612492.aspx
[24] Cawood, M., “ETS lifeline: soils capable of absorbing cattle methane”, The Australian Dairy Farmer, 3 Sep 2009, http://adf.farmonline.com.au/news/nationalrural/agribusiness/general-news/ets-lifeline-soils-capable-of-absorbing-cattle-methane/1612492.aspx
[25] Sacks, A., “The Climate Solution: Got Cows?”, Grist, 31 Jan, 2010, http://grist.org/article/the-climate-solution-got-cows/
[26] Parkinson, G., “A hiccup in the cow burp theory”, The Australian, 26 Oct 2009, http://www.theaustralian.com.au/archive/business-old/a-hiccup-in-the-cow-burp-theory/story-e6frg976-1225791141055
[27] Russell, G., “Balancing carbon with smoke and mirrors”, Brave New Climate, 31st July 2010, https://bravenewclimate.com/2010/07/31/balancing-smoke-mirrors/
[28] Cawood, M, “Error in Snowy Soils Carbon Report”, The Land, 16 July, 2010, http://www.theland.com.au/news/agriculture/agribusiness/general-news/error-in-snowy-soils-carbon-report/1887462.aspx?storypage=0
[29] The Wheeler Centre, Intelligence Squared Debates: Animals should be off the menu, Video, http://wheelercentre.com/videos/video/intelligence-squared-animals-should-be-off-the-menu/
[30] Intelligence Squared Debates: Animals should be off the menu, http://wheelercentre.com/events/event/animals-should-be-off-the-menu/
[31] Youtube video “Fiona Chambers from the meat industry gets busted – The Real Truth At Last”, https://www.youtube.com/watch?v=pEm813Zs9ec
[32] Australian Government, Department of Industry, Innovation, Climate Change, Science, Research and Tertiary Eduction, “Australian National Greenhouse Accounts: National Inventory Report 2011, Vol. 1”, p. 213 incl. Table 6.1, http://www.climatechange.gov.au/sites/climatechange/files/documents/05_2013/AUS_NIR_2011_Vol1.pdf
[33] George Wilkenfeld & Associates Pty Ltd and Energy Strategies, “National Greenhouse Gas Inventory 1990, 1995, 1999, End Use Allocation of Emissions Report to the Australian Greenhouse Office, 2003, Volume 1″, Table 5.2, p. 83.
[34] Araucaria Ecotours, Wildlife of Australia, http://www.learnaboutwildlife.com/wildlifeAustralia.html
[35] Australian Lot Feeders Association, “The Australian Cattle Feedlot Industry”, undated, http://www.feedlots.com.au/images/Briefs/cattle_industry.pdf
[36] Eshel, G., “Grass-fed beef packs a punch to environment”, Reuters Environment Forum, 8 Apr 2010, http://blogs.reuters.com/environment/2010/04/08/grass-fed-beef-packs-a-punch-to-environment/
[37] Minchin, Liz, “Oblivious to the impact of our carnivorous ways”, The Age, 13 September, 2007, Australia/New Zealand Reference Centre, ISSN: 0312-6307, Accession No. SYD-5GIJTTK2FQCG0SC2GSK and http://www.theage.com.au/news/climate-watch/oblivious-to-the-impact-of-our-carnivorous-ways/2007/09/13/1189276858297.html (Table not included in the web link.)
[38] Carlsson-Kanyama, A. & Gonzalez, A.D. “Potential Contributions of Food Consumption Patterns to Climate Change”, The American Journal of Clinical Nutrition, Vol. 89, No. 5, pp. 1704S-1709S, May 2009, http://www.ajcn.org/cgi/content/abstract/89/5/1704S
[39] George Wilkenfeld & Associates Pty Ltd and Energy Strategies, National Greenhouse Gas Inventory 1990, 1995, 1999, End Use Allocation of Emissions Report to the Australian Greenhouse Office, 2003 (Table S5, p. vii)
[40] Carbon Neutral Ltd, http://www.carbonneutral.com.au
[41] Mahony, P., “If you think it’s healthy to eat animals, perhaps you should think again”, Terrastendo, 12 February, 2013, https://terrastendo.net/2013/02/12/if-you-think-its-healthy-to-eat-animals-perhaps-you-should-think-again/
[42] J. Brodie, C. Christie, M. Devlin, D. Haynes, S. Morris, M. Ramsay, J. Waterhouse and H. Yorkston, “Catchment management and the Great Barrier Reef”, pp. 203 & 205, Water Science and Technology Vol 43 No 9 pp 203–211 © IWA Publishing 200, http://www-public.jcu.edu.au/public/groups/everyone/documents/journal_article/jcudev_015629.pdf


[…] commented on Bill McKibben’s position in my article “Do the math: There are too many cows“. [16] He appeared to be supporting a key proponent of intensive grazing systems, Allan Savory, […]
In section 2.1 the biomass is off (and biased to your POV) –
First is excludes much larger pre-settlement numbers for elk and caribou (in Northern Canada) as well as numbers for moose, wild goat and wild sheep. I’d add deer too (though current populations are high as well due to lack of other apex predators) . Elk estimates I’ve seen range from 10 to 35 million. Haven’t seen estimates for the other wild ruminants.
Wild ruminants numbers are also best guesses that fluctuated a lot largely due to weather events (e.g drought). There really are no detailed records from pre-European settlements.
Then, for all animals domestic and wild, all the numbers are using averages for cows. Cows are adult females that have given birth. Large portion of both wild and domestic ruminants are immature animals. So there are a lot of calves.The overall numbers also include bulls.Plus domestic populations have fewer bulls (bull to cow ratios are less in domestic to wild populations). More bulls pulls the “cow” average up.
So looking at more recent 2017 dairy cow and beef cattle numbers for just the US:
Using the math as done in this column’s analysis:
93.7 mill head (all dairy cows and beef cattle); avg lbs= 1227 -> totals 114970# = 52149 bill KG
Using more detailed analysis based on cows/calves/bulls/heifers/steers
cows and heifers that calved 40.1 mill total
-beef cow 32.7 mill head; 1150 (avg weight) –> 37605 bill total #’s
-dairy cow 9.4 mill head; 1500 avg —-> 14100
(angus/beef cow is 1150 lbs, holstein/dairy cow is 1500)
heifers over 500 lbs- 20.2 mill head; 800 (avg)—> 16160lb
steeers over 500 lbs- 16.4 mill head; 900 (avg)—> 14760
bulls 2.25 mill head; 2000 4500
calves under 14.4 mill head; 450 6480
———————————————————-
totals 93605 bill lbs = 42458 billion kg
=============================================
So for cattle , in the US there’s a nearly 10 billion kg over count. The more animals, the more askew the math is.
Bison avg would come down as well, but not as much since more bulls will offset the lower weights of calves. Again not many bulls are needed for domestic production.
Though interesting you use the colloquial “cow” throughout this exercise, since cattle is the accurate term. All the stats from the USDA for US inventories clearly break down cattle in the ways I described above.
Thanks for your comment. I’ll go back and look at the numbers when I get a minute, but will mention that I used McKibben’s pre-European animal population figures. In referring to “cows”, I was using the Oxford dictionary’s “loose” definition: “(loosely) a domestic bovine animal, regardless of sex or age”. That was also in line with McKibben’s article.
[…] hullabaloo is discussed in detail here, and that discussion summarized in another useful article here. A tidbit from the second article: A figure in micrograms had mistakenly been represented as […]
[…] now ranching advocates (and even climate-change leader Bill McKibben) have jumped on the “climate change” bandwagon with claims that ranching can reduce greenhouse […]
Methane obviously intensifies global warming and I wish we could stop it escaping into the atmosphere as the arctic ice melts. The craziest thing that we are allowing our governments and the multinationals to do is to extract coal seam gas, letting out large quantities of methane previously trapped in the Earth. I agree that factory farming, land clearance in the Amazon to supply McDonalds etc. etc. are big problems, but so are many other farming effects like deforestation for palm oil. Humans are omnivores, as are many other highly successful animals and hunter gatherers and small scale farmers have had working sustainable food supply systems for many 1000s of years… Basically, there are too many humans in the world (the impact of a lack of birth control is massive) and if humans all eat large quantities of animal protein it is a great impact, however a lot of us are campaigning because we love our world in its diversity, wildlife, traditional farming techniques including animal husbandry. Who would eat the grass and recycle waste food into high grade protein if not domestic animals?… Most farmers love their animals and their healthy natural lifestyles, not mining and fracking which let out a lot more methane than bovine farts do… I admire your committment to being vegan, but for the Earth’s sake we need to stick together. Please don’t muddy the cause with lifesyle choices or we will all be far too slow to act to turn our energy usage around in time to make a difference.
Hi Annette, The coal seam gas industry creates massive problems, including the release of methane that you’ve referred to. However, that does not diminish the need to tackle animal agriculture. As I have said elsewhere, the link between meat production and (for example) climate change involves many inter-related factors, such as livestock’s inherent inefficiency as a food source; the massive scale of the industry, including tens of billions of animals slaughtered annually; land clearing; and greenhouse gases such as carbon dioxide, methane and nitrous oxide, along with other warming agents. All this for a product that we do not need. We can no longer regard food choices as being personal when the impacts of those choices have far reaching consequences for our environment, others who are currently malnourished, and other species. A recent paper released by the Institute on the Enviroment at the University of Minnesota suggested: “The world’s croplands could feed four billion more people than they do now just by shifting from producing animal feed and biofuels to producing exclusively food for human consumption”.
“High grade protein” is another myth. Animal protein is harder to digest into amino acids than vegetable sources. And even if it were not a myth, and animal protein was a better food source and not the leading cause all those western epidemics like heart disease, type two diabetes, cancer, osteoporosis, macular degeneration,… it is still a fact that factors of ten to thousands more water and energy goes into one joule of meat when compared to one joule of fruit or vege. We are infact most closely related to the primates that are frugivores not omnivores they eat 90/10/10 carb/fat/protein and humans are around 80/10/10 optimal. Many elite athletes re discovering this truth now that drugs in sport are getting clamped down on, it’s the new edge, optimal eating for optimal fitness and animal protein is not a part of it.
I agree that there isn’t much point in extending this exchange. I think focusing excessively on issues like foregone sequestration or the use of higher GWPs for methane is potentially dangerous, as it shifts attention from fossil fuels and the long-term consequences of burning them. Foregone sequestration from land use is really just another way of saying that unlike fossil fuel combustion, lost terrestrial carbon storage from past LULUCF is (potentially) reversible. While it may be useful to remember these options exist, I disagree with the premise that not exercising them in a given year is somehow equivalent to emitting the same amount of CO2 through an irreversible process (which is what the G&A framework does).
.
As I said in the article (with capitals here for emphasis): “McKibben’s main focus is fossil fuels, AND I AGREE IT’S ESSENTIAL THAT WE DEAL WITH THEM. However, I also argue that we will not overcome climate change without a general move away from animal agriculture.”
The second sentence is supported by the work of James Hansen and colleagues, also referred to in the article.
“Another critical issue is land use, including foregone sequestration on land previously cleared.
The report highlighted the fact that “Livestock’s Long Shadow” did not allow for foregone sequestration on land cleared in the years prior to the reporting period, although Goodland and Anhang did not fully incorporate the impact of such foregone sequestration, as referred to below.”
This claim ignores the conventions behind IPCC greenhouse gas inventory methodologies. The land use change and forestry (LUCF) that make up part of the emissions figures used by both the FAO and G&A treat conversion of forestry into pasture or cropland as positive emissions, while abandoning cropland and pasture and allowing it to revert to forest is treated as negative emissions. This makes sense, given that the objective is to measure the extent to which human activities are making a net contribution of GHGs to the atmosphere.
The IPCC figures already do account for forgone emissions. Consider a farm with direct emissions (from fuel consumption, fertilizer, enteric emissions, etc.) of 50 tCO2e, which could be allowed to revert to forest and sequester 20 tCO2e per year. Actual emissions for the farm are 50 tCO2e, while emissions for the alternative are -20tCO2e. The difference between the two is 70tCO2e.
It’s certainly possible to argue that the 7.1 GtCO2e that the 2006 FAO study attributes to livestock understates the extent to which reducing livestock may allow for mitigation, if reforestration strategies are pursued, since reforestration would reduce emissions (i.e. create negative emissions). However, these options are already accounted for in the existing GHG inventory methods. Adding foregone sequestration to figures that are constructed from IPCC methods, as G&A do (and as you seem to be advocating) amounts to double-counting.
Goodland & Anhang were clear in their comments on foregone sequestration, including, “The FAO counts emissions attributable to changes in land use due to the introduction of livestock, but only the relatively small amount of GHGs from changes each year. Strangely, it does not count the much larger amount of annual GHG reductions from photosynthesis that are foregone by using 26 percent of land worldwide for grazing livestock and 33 percent of arable land for growing feed, rather than allowing it to regenerate forest.”
It’s not clear to me that what you’ve described represents an accounting of foregone sequestration. The fact that abandoning cropland and pasture and allowing it to revert to forest will achieve negative emissions (something favourable) does not mean that failure to do so is counted as positive emissions (something unfavourable).
According to Australia’s National Greenhouse Gas Inventory, land use change under the UNFCCC includes emissions and removals from all forest lands cleared in a given year as well as ongoing emissions from the loss of biomass and soil carbon on lands previously cleared. That also does not appear to represent an accounting of foregone sequestration.
The point is simply this…foregone sequestration is not the same as actual additions to the atmosphere, which is what the UNFCCC GHG inventories are measuring. Most of those opportunities were created by past land change, which would have already resulted in emissions being added once, so adding an ongoing penalty for emissions that were not sequestered amounts to double-counting for the same land over time. This amounts to a rather bizarre lifecycle accounting exercise, where gases are added once at the time they are actually added, and then a portion is continuously added on the basis of an unrealized counterfactual (the land use portion of LULUCF is intended to measure subsequent soil carbon losses in the current use).
In any case, G&A mislead by calling their figures “emissions.” The “uncounted” land use figures they introduce, along with their later justification for respiration as proxy for this same concept, are emissions relative to a vaguely defined counterfactual, rather than actual emissions in 2000. These emissions don’t exist under IPCC conventions, and have no relevance to discussions around the remaining carbon budget (and don’t reflect actually increases in atmospheric GHGs). Of course, G&A also fall to mention that the Kyoto Protocol targets are framed in terms of the 100 year GWPs, meaning that their own advocacy for a 20 year time frame is irrelevant for countries committed to existing carbon treaties.
The difference between what the UNFCCC/IPCC conventions do and what you are advocating is similar to the difference between what zero represents in the Kelvin temperature scale and the Celcius temperature scale (i.e. reference points). In the IPCC system, zero is the start of the actual year, and the figures measure the net flux to the atmosphere between the beginning and the end of the year. In your case, zero is a counterfactual where land used to feed/pasture animals is allowed to revert to forest/natural grasslands and emissions are the sum of unrealized sequestration and the actual net flux that is added over the year. If actual sequestration through land use was realized, it would have the same absolute change (in CO2e) in emissions and the official figures. In your case, you would remove the penalty, and in the established GHG inventory methodology, sequestration would result in the same amount being subtracted.
Here’s an example that I think illustrates why including foregone emissions makes no sense. Suppose there are ten acres of mature forest, each sequestering 1 ton of CO2. If the forest is burnt down, all the carbon is released, but in the subsequent year, new vegetation will begin to regrow, sequestering 5 percent of the CO2 emitted previously. The land owner clears one acre per year. In addition, each year the land owner clears new vegetation by fire, preventing any new sequestration.
Under the UNFCCC LULUCF framework, 1 ton is released in each year. Summing emissions over 10 years yields 10 tons, the actual amount of CO2 added to the atmosphere over the period.
In a framework that includes foregone sequestration, there is 1 ton of emissions in the first year, 1.05 in the second year, 1.1 in the third year, up to 1.45 tons in the final year. These clearly don’t sum to the net increment to the atmosphere, because the reference isn’t relative to the previous year, but to an ever-changing counterfactual (as an increasing amount of land is cleared, the sequestration potential increases).
If in the 11th year, new vegetation is burnt, under the UNFCCC framework, there is no net addition. Under a framework measuring foregone sequestration, .5 tons of emissions are recorded. However, these aren’t actual additions to the atmosphere. As was the case before for this framework, the sum of current and past emissions is meaningless, unless one corrects for the changing reference scenario.
Finally, suppose that in the 12th year, the land is abandoned and new vegetation grows. The IPCC framework measures emissions of -.5 tons, the actual withdrawal due to reforestation. Furthermore, the sum of current and previous emissions correctly recorded the net addition of CO2 over the 12-year period (9.5 tons).
For the measure including foregone emissions, here are no more foregone emissions, so the penalty vanishes. Emissions are now zero, even though carbon in the atmosphere is being removed, since there is now no difference between actual and counterfactual emissions.
And drawing on my example further, if after two years, the landowner stopped clearing more land, allowing one acre of land to reforest and continuing to burn new vegetation on the second acre, the emissions would be recorded as -.05 tons under the adopted GHG inventory framework. This reflects the actual amount of carbon being removed that year.
Adding .05 tons to the LULUCF emissions to account for the foregone portion, as G&A seem to be advocating means emissions are recorded as zero. I’m not sure what the counterfactual even is in this case. I think the problem is that numbers with two different reference points are being added, which is an inconsistency that creates further confusion.
We’ve dealt with the 20-year GWP issue previously. Just because the IPCC uses a 100-year measure does not mean that the 20-year measure is not valid. It’s particularly valid when considering tipping points and the need to respond urgently to the climate crisis. Besides, many people regard the IPCC as overly conservative. For different reasons, former Australian of the Year and former Chief Climate Commissioner, Prof Tim Flannery has described it as “painfully conservative” because it “works by consensus and includes government representatives from the United States, China and Saudi Arabia, all of whom must assent to every word of every finding”.
To consider foregone sequestration is also valid. We could talk forever about appropriate ways to take it into account, but the key point is that by considering it, we help to identify critical climate change mitigation measures that might otherwise be ignored.
I don’t intend continuing this discussion forever. In my original post, I simply gave Goodland and Anhang’s paper as an example of a higher estimate of animal agriculture’s impact than that offered by the FAO. Like his colleague Jeff Anhang, the late Robert Goodland was a credible commentator on these issues.
I’ve had a further realization about the G&A analysis: they don’t even understand the exercise that the FAO is attempting. The FAO is taking an existing estimate of total emissions (direct & land use change) for 2000 from the WRI and determining what share of this figure is attributable to livestock. The calculations would be complex and would include things like “What is the share of emissions attributable to corn production, and what share of that is fed to livestock?” and so forth. While it is certainly possibly that the FAO could have underestimated some components, the correct response isn’t to add them to the total (as G&A do), but to adjust the attribution accordingly (similar to their health and cooking adjustment).
I also tracked down the article by Calverd outlining the emissions figure. Calverd starts with the assumption that per capita power from fossil fuels is 1500W. Using a figure of 2W/kg for metabolism, he assumes an average mass of 75 kg for humans, and meat consumption of 75 kg. With the further assumption that meat consumption requires three times the mass of consumption, he concludes than average human power consumption is 150 W and livestock consumption is 450W. Assuming emissions are proportionate, livestock accounts for 21% of CO2 emitted from a combination of fossil fuel consumption, and respiration of humans and their livestock. However, G&A apply the 21 percent figure to the WRI figures, which exclude respiration (with good reason) and include land use estimates and other gases (e.g. methane). In the WRI figures, CO2 from fossil fuel consumption accounts for 58.8 percent of total emissions, or about 24.6 GT. The Calverd estimate implies that livestock respiration would be about 7.4 GT. (vs. the 8.7 they report) Given that Goodland accounts for 4 of the 7 citations of Calverd on Google Scholar, you’d think they could get that much right at least. Of course, G&A also fail to mention that the FAO provides it’s own estimate of respiration at 3.161 GT (2006, pg. 96). Calverd’s estimate of average meat consumption is higher than anything I’ve seen elsewhere (although clearly figures for the US and some other countries would exceed it, though that is also true for average power from fossil fuels).
I meant to say that meat consumption is assumed to require three times the mass of consumption in standing animals.
Hi James,
You’ve said you’re not sure why I’m “so keen on defending [G&A’s] results”. I’m not saying their results are perfect, but I think we agree there are valid arguments to suggest that livestock’s share of overall emissions is higher than the FAO’s figure of 18%.
In regard to my point 4, you’ve said that applying a higher GWP to methane would “increase the share [of emissions] attributable to livestock”, “provided methane is the larger of the two categories” [i.e. methane and non-methane GHGs].
I agree it’s possible (depending on the scenarios considered) that a higher GWP for methane will not result in livestock having a higher overall share of CO2-e emissions, but I’m not sure about your comment “provided methane is the larger of the two categories” (presumably based on a 100 year GWP).
In any event, I’ve quickly put together this comparison (which I’ll check again), which uses hypothetical figures for modelling purposes: https://terrastendo.files.wordpress.com/2013/08/ch4-co2-livestock-other.jpg.
Based on the numbers shown, it indicates that, with methane CO2-e emissions being lower than other emissions at the 100 year level, livestock’s share of overall emissions increases with increases in the GWP.
Hi Paul,
There’s nothing wrong with your example. However, my point was simply that further increments to the GWP of methane when livestock’s share of emissions is 37 percent will not increase livestock’s share of GHGs above 37 percent In your own table, as the GWP increases, the share gets closer and closer to 37 percent. If you had used hypothetical numbers in which livestock’s share of other gases was greater than 37 percent, increasing the GWP would decrease livestock’s share of total emissions, though never below 37 percent (the numbers would be higher than this for lower GWPs for methane).
One thing I’ve realized about Australia is that the country is something of an outlier as far as livestock goes. In particular, production of cattle on a per capita basis is substantially higher than in most other developed countries (I’m guessing a lot gets exported) . The estimates I’ve seen for livestock’s share of methane production in the US are similar to those the the FAO provides for the world. However, the figures I’ve seen for Australia are around two thirds, so (assuming methane’s share of GHGs are similar for two countries) increasing the GWP of methane will have a more pronounced effect on livestock’s share of total GWGs for Oz. Reduction of the standing population of cattle is probably a more effective strategy for achieving large reductions of emissions in Australia as a result (although both countries would benefit from doing so).
I have to agree with you after reflection that Gavin Schmidt’s comments about the revised GWP not applying seems wrong to me too. Geoff Russell also appears to be puzzled by his comments, but Schmidt never offers a further clarification. Schmidt had promised a future article that would revisit the attribution issue, but that was four years ago…
-James
2. With regard
BTW, I came across both the FAO and G&A analysis after sharing the perspective of Kevin Anderson and Alice Bows on the daunting challenge of avoiding temperature changes later this century with students in one of my classes. Anderson and Bows indicate that Annex 1 countries need to reduce emissions by ten percent year on year, implying a 40 percent reduction by 2015, a 70 percent reduction by 2020 and 90 percent reduction by 2030. A student suggested that eliminating meat would suffice, so I did some research to see if he was right. After visiting the two papers, I think that in addition to a fairly radical rethink of our diet, a lot more would be required to meet these goals.
Admittedly I haven’t applied the same degree of scrutiny to the Anderson and Bows paper as I’ve applied to the G&A analysis…
Hi James, just a few comments.
1. You have pointed out that Gavin Schmidt says G&A are incorrect in claiming that the IPCC only backs a 20-year GWP for methane. To quote Schmidt, “. . . nor is their claim of IPCC backing for an exclusive use of the 20 year timescale . . .”. However, G&A didn’t say that. They said (p. 13) “The Intergovernmental Panel on Climate Change supports using a 20-year timeframe for methane”. They did not say that such support was exclusive. I have always said that it depends on what aspects of climate change you are focusing as to which GWP is more appropriate. For example, if you’re concerned about: (a) potential near-term tipping points; or (b) relatively rapid mitigation measures; then the 20-year GWP would seem appropriate. If you’re concerned about long term greenhouse gas concentrations, then the 100-year GWP might be better.
2. Schmidt says, “GWP estimates . . . are all for comparing the integrated effects of a future emission of a kilo of CH4 compared to a kilo of CO2. The claim in the WW report was related to forcings today (which are the net effect of many past emissions), so they aren’t really comparable”. I find it difficult to reconcile that comment with the fact that G&A’s article (i.e. the “WW report”) was attributing a share of annual global GHG emissions to livestock. Those annual emissions would have different global warming impacts depending on which GWP was utilised for methane, so it was a question of how much warming would occur over the next 20 years or, alternatively, the next 100. It was not a question (from my reading of G&A) of reporting (in Schmidt’s words) “forcings today (which are the net effect of many past emissions)”.
3. I believe G&A’s approach is consistent with that of Prof Barry Brook, head of climate science at The University of Adelaide, and Geoff Russell in their 2007 Australasian Science article, “Meat’s Carbon Hoofprint” (http://www.control.com.au/bi2007/2810Brook.pdf), in which they reported that methane from livestock in Australia would cause more warming over the next 20 years than all our coal-fired power stations combined. (Australia’s electricity generation is 90% coal-fired.) They said: “Annually, Australian livestock produce about 3 million tonnes (Mt) of methane. Using the 100-year GWP, this 3 Mt of methane represents 63 Mt of CO2-e. As a comparison, all of Australia’s passenger vehicles produce about 43Mt of CO2. Using the 20-year factor of 72 (which comes from the Intergovernmental Panel on Climate Change’s Fourth Assessment Report), it is clear that this 3 Mt has an impact on global warming, during the following 20 years, that is equivalent to 216Mt of CO2 emissions. This is more than the atmospheric heating caused by emissions from all of Australia’s coal-fired power stations!”
4. You have said: “Applying the GWP of 72 to non-livestock emissions results in a figure of 45% (providing one accepts the remaining figures in G&A, which I don’t). Unless livestock’s share of methane exceeds this figure (G&A use the 37 percent figure from the FAO), increasing the GWP (to say 105), will not further increase this percentage (I’ll leave the math to you).” I disagree. By applying a GWP of 105, the percentage contribution of all methane sources, including livestock, would increase relative to non-methane GHG sources.
I’m not really all that interested in debating whether the 20 or the 100 year GWP is more appropriate. I agree in general with you in point #1 that they both have their uses. I think the statement in G&A is misleading, as the IPCC supports both the 20 and 100 year time frames. However, G&A’s statement regarding uncounted methane is also misleading, since they are evaluating emissions over a shorter timeframe (not to mention their curious decision not to make the same adjustment to non-livestock methane).
With regards to point #4, you are incorrect. Livestock’s proportion of GHGs (as a percentage) is the sum of livestock’s proportion of methane multiplied by methane’s overall proportion of emissions (in CO2e) and livestock’s proportion of remaining GHG’s multipled by the proportion of remaining GHGs. Increasing the GWP of methane will increase methane’s overall share and decrease the remaining gases overall share. The net effect will depend on the livestock’s shares of the two categories; provided that methane is the larger of the two (which is not the case in the G&A analysis) such an adjustment will increase the share attributable to livestock. However, the limits of such an increase can be seen by considering an extreme GWP (say 1000 for the sake of illustration). In this case, nearly all GHGs are methane. However, since livestock accounts for 37 percent of methane, it would account for 37 percent of GHGs.
Given G&A’s decision to take seriously Calvert’s faulty analysis, which is central to their estimate, I’m not sure why you’re so keen on defending their results.
BTW, if, instead of taking G&A’s figures and adding the adjustment for non-livestock emissions using the higher GWP, I replicate their calculations using the (dated) 100-year GWP, I get a figure of 47 percent (instead of 45 percent). This involves simply subtracting their adjustment figure for livestock of 5047 from both the numerator and denominator. This illustrates that increasing the GWP of methane will not unequivocally increase livestock’s share.
It’s probably also worth noting that I’m not disagreeing with the central premise of your posting. I doubt the wisdom of clearing rainforest to either graze cattle or grow soy as feedstock for livestock. I also acknowledge that meat is energy (and thus carbon) intensive, and then reducing consumption may well be a necessity in an effective strategy to reduce emissions. Nor am I endorsing the FAO figure; I think G&A are correct in noting that there are additional land use and other considerations that are not incorporated in the FAO study, and that given the land requirements of rising livestock, a thorough accounting of these considerations may well result in a higher share. However, for reasons I’ve outlined in some detail, I don’t find their estimates (at least 51 percent) credible.
A couple more comments:
1. The CAIT figures were revised after the FAO and G&A analysis. The major changes were to the land use change (LUC) figures, which were decreased. Given that a third of the FAO’s attribution to livestock was based on land use, i’m guessing that a re-evaluation with the new LUC figures and the sources that are accounted for in the FAO study would result in a figure less than the original 18 percent (with the caveat that the LUC estimates have a high degree of uncertainty, allowing for the possibility of either a higher or lower number).l
2. I’m also going to reconsider my critique of G&A. Clearly the adjustment made for 2009 tonnage (an additional 2560 Mt of CO2e) is inappropriate, given the numbers are from 2000. However, I’m willing to accept the premise that the biofuel scenario provides a reasonable lower bound for additional sequestration land use potential in the absence of alternative estimates. I’ll even accept that given that it is a lower bound, a proper accounting of both livestock and non-livestock land use figures wouldn’t greatly affect the overall percentage .
The initial draft of the paper takes seriously the premise by Calvard (2005) that respiration should be included as emissions. This raises two issues (beyond the issue of whether respiration is carbon neutral). Given that Calvard uses back of the envelope calculations to obtain his estimate, the first question is how accurate estimates based on these calculations are. G&A reach a figure of 8769 Mt. Vaclav Smil (2013) suggests that this over-estimates the figure by a factor of more than two (he arrives at an estimate of 3000 Mt, using sources that were not available to G&A at the time of their analysis, but notes that an alternative estimate of 5500 Mt was available when the original analysis was conducted). The second problem is that Calvard argues that human respiration should also be included, which if I recall correctly, he estimates at a third of that of livestock (which would be 2923 Mt). Adding the missing human respiration (2923 Mt) and the additional non-livestock methane using the 20 year GWP (8594 Mt), and netting out the erroneous correction for a tonnage increase that don’t happen for another 9 years (2560Mt) yields a figure of at least 41 percent. Adjustments to either the livestock respiration figure or the ratio of livestock to human respiration will affect this figure in ways that I will not address here.
Critics subsequently argued that including respiration was inappropriate, noting that it was part of a carbon cycle. G&A responded by dropping the Calvard premise and argued that the respiration figures were estimates of a carbon imbalance. However, this premise is (as David Steele notes) essentially a land use consideration. This raises several issues with regards to the calculations in G&A. First, why is a land use estimate (the 8769 Mt) being added to a lower bound estimate of land use considerations not considered by the FAO study (the 2672 Mt from the biofuel scenario)? What does this sum represent? Second, is there any reason to believe that the respiration (independently of whether it is an accurate estimate of respiration) a “good” estimate of the missing forgone opportunities? If it exceeds the true value, G&A’s figures over estimate livestock’s contributions. If it is close to the true value, excluding estimates for non-livestock land use will result in a figure that overstates livestock’s contribution. The problem is that without secondary sources to evaluate their estimates, there is no way to evaluate the credibility of this number. If the respiration figure is dropped, and the original lower bound is used (2672 Mt), along with the tonnage adjustment and non-livestock methane adjustment, the figure is at least 35 percent. However, this figures still depend on the reliability of G&A’s misallocated carbon figures (impossible to asses given the documentation provided in the paper) and the various adjustments they make to livestock (which David Steele argues involving going from the most conservation to the most extreme estimates).
-James
Hi OnceJolly,
In point 2, you have said: “In any case, there is no indication that G&A reweigh non-livestock emissions using the 20 year GWP.”
I wasn’t disputing that, as they said in their original article: “Further work is needed to recalibrate methane emissions other than those attributable to livestock products using a 20-year timeframe.”
My point was that if they used NASA’s GWP of 105 rather than 72, then the revised figure may have been something higher than the 45% that you mentioned.
In point 3, you have said: “the foregone opportunity is already measured by the emissions that were released because that opportunity wasn’t realized.”
The problem I see with that view is that emissions from land-clearing are already accounted for, but the forest and other vegetation would continually be sequestering carbon if they still existed. That is a lost opportunity that is not accounted for, which causes us to ignore one of the key mitigation measures, i.e. reforestation and other forms of revegetation.
You say: “suppose the sequestration potential was actually realized; you would then have to subtract both the measure for the foregone opportunity *and* the actual emissions!”
I disagree. If we were to revegetate large areas, then the relevant sequestration measures could be subtracted, but not the original emissions. They occurred, and nothing will change that. The reforestation would draw down carbon emissions from all sources, including the original land-clearing emissions, fossil fuel and other emissions.
Hi Paul,
1. Gavin Schmidt, who works with the NASA Goddard Institution (and was an author on the relevant paper), has commented on G&A and the revised GWP figure of 105 and has indicated that he thinks the adjustment you are indicating is inappropriate. See his response to comment #87 of the following thread:
http://www.realclimate.org/index.php/archives/2012/01/much-ado-about-methane/comment-page-2/#comments
He also questions whether the 20 year figure is more appropriate than the 100 year figure and states that G&A are incorrect in claiming that the IPCC only backs the former number.
In any case (see 3 below), given that all of G&A’s “uncounted” emissions are problematic, you’ll need more work than a higher GWP to credibly assert their “at least 51 percent of GHGs) finding.
2. On foregone sequestration, I was commenting specifically on the numbers that G&A use. I later agree below that other foregone opportunities may apply, but that it is G&A’s obligation to provide reliable estimates for these based on peer-reviewed research. Also, these opportunities apply to agriculture more generally.
3. I stand my initial post in which I claim that various “uncounted” items that G&A add to are either inappropriate (increments to livestock tonnage from 2002 to 2009, the biofuel scenario, respiration or inconsistent (methane). As I note below, G&A use 2000 figures (while their comment in the link you provide implies otherwise, it appears to amount to equivocation on why they didn’t use the 20 year GWP for non-livestock methane rather than the addressing any issue of substance). As I’ve shown, the actual number used in their paper is for 2000, which can be verified from the indicated table in the linked document.
-OnceJolly
BTW, David Steele of Earthsave Canada has offered his own take on the G&A analysis. Clearly I disagree with him over the appropriateness of updating livestock figures to reflect 2009 levels, given that G&A are working with figures from 2000. He argues for a figure of around 30 percent, using alternative estimates of the considerations that G&A outline.
http://vegan.com/articles/environment/a-sympathetic-but-skeptical-look-at-goodland-and-anhangs-livestock-and-climate-change/
Applying the GWP of 72 to non-livestock emissions results in a figure of 45% (providing one accepts the remaining figures in G&A, which I don’t). Unless livestock’s share of methane exceeds this figure (G&A use the 37 percent figure from the FAO), increasing the GWP (to say 105), will not further increase this percentage (I’ll leave the math to you).
Hi OnceJolly, here are my responses:
RESPIRATION:
I mentioned in my post that some may argue that G&A should not have included respiration in their analysis. On my calculations, by excluding that factor and allowing G&A’s other points, livestock’s share of global emissions would be 43%. G&A have responded here to feedback on their paper, including the respiration issue: http://awellfedworld.org/sites/awellfedworld.org/files/pdf/WWMLivestock-ClimateResponses.pdf. I assume you’ve seen that article but still disagree with their position.
METHANE:
You’ve indicated that allowing for non-livestock sources of methane would account for around 6% of emissions (51% less 45%). Is that based on your own calculations, or do you have a source? It may be correct if you use a 20-year GWP of 72 for methane, as used by G&A. However, NASA have since indicated that methane’s GWP may be as high as 105, which may reduce the figure of 6% to something smaller, given livestock’s significant share of global methane emissions.
In my own calculations for Australia based the 2008 greenhouse gas inventory (referred to in my “Omissions of Emissions” article), I allowed for increases in livestock and non-livestock methane sources. With the inclusion of livestock-related land clearing and savanna burning, livestock’s share increased from around 11% to around 30%. Beyond Zero Emissions have gone further, and (as referred to in my McKibben article) have generated a preliminary estimate of around 50%.
UNCOUNTED LIVESTOCK:
I believe you are incorrect in saying that G&A did not update the remaining GHG figures to reflect 2009 levels. In Goodland’s “response” article (refer above), he stated, “We used available data from the World Resources Institute for annual increases in non-livestock emissions, as cited in our sources (at http://www.worldwatch.org/ww/livestock).”
LAND USE:
I believe that G&A only used the biofuels scenario as a way of assigning some numbers to foregone sequestration in the absence of something more specific. You’re concerned that “this opens up the door to all kinds of extra considerations that the data from the FAO study does not directly deal with”. However: (a) the massive scale of livestock-related land use; (b) the imperative of drawing down carbon; and (c) the ability to do so through regeneration of original vegetation on land currently used for grazing and feedcrops; could justify G&A’s approach.
The need to regenerate forest and other vegetation to sequester carbon is critical, and has been emphasised by the PBL Netherlands Evironmental Assessment Agency and the Centre for Alternative Technology in Wales (regarding the Zero Carbon Britain plan), as referred to in my “Prince Charles” article.
They said:
Netherlands agency: “. . . a global food transition to less meat, or even a complete switch to plant-based protein food [was found] to have a dramatic effect on land use. Up to 2,700 Mha of pasture and 100 Mha of cropland could be abandoned, resulting in a large carbon uptake from regrowing vegetation. Additionally, methane and nitrous oxide emissions would be reduced substantially.”
They said a plant-based diet would reduce climate change mitigation costs by 80%. A meat-free diet would reduce them by 70%.
Centre for Alternative Technology: “Zero Carbon Britain 2030 will revolutionise our landscape and diets. An 80% reduction in meat and dairy production will free up land to grow our own food and fuel whilst also sequestering carbon from the atmosphere. The report also represents an opportunity to tackle the relationship between diet and health in the UK by promoting healthier diets and lifestyles.”
POTENTIAL REDUCTIONS THROUGH G&A’S MEASURES VS DECARBONISATION OF ELECTRICAL GRID:
We need to move away from animal agriculture and fossil fuels. G&A’s measures (particularly reductions in livestock-related methane emissions) can buy us time while the energy infrastructure is replaced.
GENERAL:
G&A argued that livestock were responsible for at least 51% of emissions, so any reductions in their estimate could arguably be starting from somewhere above that figure.
As an aside, it’s interesting to have seen McKibben dismiss G&A’s work against the background of an online discussion I recently became aware of. It was within a group called “Soil Age” (https://groups.google.com/forum/#!topic/soil-age/CQfegdn_B3c), and involved a number of people claiming credit for providing McKibben with much of the material contained in his Orion magazine article, which was lacking references.
They included Adam Sacks of Grist, mentioned in my article as quoting the methane absorption figures that were subsequently found to be massively overstated.
Another is Seth Itzkan, who is a strong promoter of “holistic management”.
In one comment, Itzkan said to Sacks: “Hi Adam, Yes. This article is a direct result of your interaction with him [McKibben] and the subsequent correspondences that you, me, and Jim had with him in the following weeks, both the general theme, as well as the particulars and specifically all the language about about [sic] electric fences, dung beetles, predators, and of course ‘methane-loving bacteria’. He was profoundly influenced, and grateful for our influence, and I’m thankful to you for helping to make that connection.”
My responses (which I’ll limit to issues directly related to the G&A paper):
1. Updating of the figures – I’ve gone back to the FAO paper, and given that the figures on Table 3.12 don’t match up exactly with the G&A figures, I think you’re right that G&A have used later figures. However, they cite the 2005 WRI CAIT, which still implies a four year mismatch with 2009 figures (given that currently the last available year is 2010, I suspect the 2009 figures were not available when G&A wrote their paper).
2. Methane. G&A report an “extra” 5.047 GT of CO2e from livestock using the 20 year GWP instead of the 100 year figure. Since the former GWP used by G&A is roughly 3 times that of the latter (72 vs 25), this implies emissions of roughly 2.5 GT of CO2e (the precise figure is 2.67). Using the 100 year figure. the CAIT reports methane emissions using the 100 year GWP and reports total methane emissions of 6.8 GT of CO2e. My earlier calculation was based on the figures reported in Table 3.12 of the earlier FAO study (or rather, use of the 63 percent figure, along with G&A’s numbers…i.e. an extra 63/37 of their increment for livestock methane). In any case, there is no indication that G&A reweigh non-livestock emissions using the 20 year GWP.
3. You note: “I believe that G&A only used the biofuels scenario as a way of assigning some numbers to foregone sequestration in the absence of something more specific.” Yes, but the foregone opportunity is already measured by the emissions that were released because that opportunity wasn’t realized. G&A are mistaken in adding these figures again to current emissions. To see this, suppose the sequestration potential was actually realized; you would then have to subtract both the measure for the foregone opportunity *and* the actual emissions! I suppose you could reallocate some portion of, say, coal emissions for power generation to livestock to account for such foregone opportunities, but I think this is problematic (see my earlier point about conceptional differences between the FAO and G&A figures).
Finally, you observe:
“G&A argued that livestock were responsible for at least 51% of emissions, so any reductions in their estimate could arguably be starting from somewhere above that figure.”
I’m not sure why I’m expected to accept that claim, unless they are actually supported by the figures that G&A provide. G&A claim their numbers are “conservative” figures, but this includes the inclusion of respiration (which, outside of the issue of whether it should be included, may be overestimated) and an asymmetric treatment of methane, which will exaggerate livestock’s role.
Just to clarify, the 2.67 figure in point #2 is livestock’s methane emissions in GT of CO2e evaluated using the 100 year GWP.
BTW, I’m also doubtful that G&A have done the 2005 updating in a way that’s consistent with the FAO’s 18 percent estimate. The CAIT figures show a 12.4 percent increase in emissions between 2000 and 2005 (including land use), while the difference between the FAO and G&A inventories is around 6 percent (before the latter add their “uncounted” emissions). The FAO uses the CAIT’s figures for emitted gases, but provides land use figures that are significantly higher than those provided by the CAIT. The FAO uses different estimates regarding land use that appear to account for this discrepancy; these estimates also form over a quarter of the CO2e that the FAO study attributes to livestock.
I take your point that other sequestration possibilities exist. However, the scenario included in G&A’s calculations is inappropriate, and the onus is on the authors to provide reliable estimates of other opportunities (which again, will include non-livestock agriculture). Given that two increments in the G&A are dubious (respiration and unaccounted land use), and one requires further increments in non-livestock emissions (the use of a 20 year time frame for GWP of methane), I don’t think it’s appropriate to claim that G&A demonstrate that at least 51 percent of GHGs can be attributed to livestock.
I’ve found the estimate that G&A start with in their analysis (41755 MT CO2e), which is for 2000. See the footnote to figure on page 5 of the linked paper below. So no, they don’t update their figures to reflect 2005 emissions. Instead, they take the the 18 percent figure from the FAO study and the 2000 figures listed above and use them to derive their starting emissions of 7.516 GT. I find different numbers in different places at the WRI website. I’m not sure whether this is due to figures being periodically revised over time or some other reason. The FAO figures for emissions are somewhat lower, but at least it’s now clear why the difference between the figures between the two studies doesn’t reflect the changes in emissions that occurred between 2000 and 2005.
Click to access navigating_numbers.pdf
Sorry to keep cluttering your blog, but apparently the source of my confusion is that the WRI publication linked above (and G&A) use version 3.0 of the CAIT, while the version that is freely available through the WRI website is version 2.0. The FAO figures are based on the version that was available online in February 2006.
It helps to assess the G&A paper if one is clear on a number of issues. The first key question is for what period the 51% is supposed to apply. The original FAO study uses emission figures for 2000, using the World Resource Institute’s Climate Analysis Indicator Tool. The FAO study proceeds to attribute a portion of these figures to livestock, while making some additional increments due to land use. G&A start with the FAO figures, make some additional attributions to livestock (health, refrigeration and cooking), and then proceed to find addition sources that they claim are important but not included in the FAO study. Below, I list three of their contributions, including problems with each:
1. Respiration – this is both the largest and most controversial,because it is viewed as part of an ongoing carbon cycle (G&A have latter claimed that this a proxy for lost CO2 sequestration from the soil, but without any indication that this is a reasonable estimate). Furthermore, Vaclav Smil (2013) has indicated that G&A use a questionable estimate for respiration (a non-peer reviewed editorial by Calvard), and that the actual figure, based on other studies, would be smaller.
2. Methane – the second largest figure. If one wishes to use the higher GWP, consistency demands that it also be done with man-made sources of methane produced in other sectors. Using the 2000 figures, this is 63 percent, resulting in an additional 8600 million tons of GHG not accounted for in the FAO study, but which is added only to the denominator. Even without removing G&A’s own estimates of respiration, the share of livestock falls to 45 percent. Dropping respiration and consistently using the 20 year GWP reduces livestock’s share to 37.3 percent.
3. Uncounted livestock – G&A note that in 2009, the tonnage of livestock products had increased since the FAO study, and make adjustments accordingly. However, they do not update the remaining GHG figures to reflect 2009 levels accordingly. Making adjustments to livestock but not all figures makes any subsequent shares of GHG meaningless (or rather, 2009 levels of livestock account for 51 percent of 2000 GHGs, providing that we also inconsistently treat methane from difference sources and include problematic estimates of animal respiration). Subtracting off the 2560 million tons they attribute to the increase in livestock from 2002 to 2009 (pg. 14), along with dropping respiration and treating methane consistently yields a figure of about a third. Alternatively, one could retain G&A’s increments for livestock, but also change non-livestock figures to reflect 2009 figures.
Given just these obvious problems with G&A, one can hardly fault McKibben for not giving the G&A the status the OP believes the study is due.
Vaclav Smil (2013) “Should We Eat Meat? Evolution and Consequences of Modern Carnivory”
Thanks for your comments. I’m unable to respond today but will aim to comment in a day or two.
Just to clarify, Smil argues that respiration estimates from Jentsch et al (2009) and FAO figures on livestock for 2010 imply that respiration accounted for 3Gt of CO2 emissions in that year . This figure is significantly lower than G&A’s estimate of 8.8 Gt.
I think the G&A article can be evaluated as attempting three goals:
1. Identifying sources of emissions from livestock that were missed by the 2006 FAO study.
2. Attempting to provide estimates of these emissions.
3. and using these estimates to provide a revised estimate of the share of overall emissions from livestock.
On point #3, I think the paper fails badly. Failure to adjust methane sources outside the livestock sector with the alternative GWP is inexcusable, either indicating sloppiness or an agenda on the part of the authors. Not updating other sources to 2009 levels might be excusable, if the authors had reason to believe that other sources had not grown, but I don’t see any credible reason to believe this, given the economic expansion of the BRICs (IIRC, the WRI CAIT shows approximately a 2.5% increase in emissions per annum). Unfortunately, the 51 percent figure ends up being the result of the paper that is emphasized.
I think that livestock (and particularly cattle) do make significant contributions to AGW. I also expect estimates of the sector’s contributions will continue to change as our understanding of various mechanisms improves. However, G&A is a flawed study, and one of the most problematic figures from the study is also the most widely cited.
I’m now convinced that the FAO figures and G&A’s figures measure different concepts. The FAO is tallying up all actual emissions from humans and using actual inputs to attribute GHGs to different sources. G&A are trying to compare GHGs to a scenario in which livestock is replaced with vegetable protein, and land is either allowed to revert to nature or is used to grow bio-fuels, which can be used to displace coal. I don’t think G&A get the implementation correct; they should be measuring existing emissions and computing the emissions that would exist under their alternative scenario, rather than adding the difference to current emissions. They could then talk about the potential reduction that such a change would result in. However, while such a method is useful for contemplating the relative value of possible directions for reducing GHGs, any number of alternative scenarios can be considered. One could just as easily consider a scenario in which the electrical grid was decarbonized, reducing the emissions for refrigeration and health care interventions from livestock product consumption, and chicken replaced beef and pork, eliminating most of the methane produced by the sector.
Since I’m revisiting the G&A paper for the first time in awhile, I thought I would add a comment about the land usage figures. One problem is that again, G&A bias their results by not applying the same considerations to other land use (in particular, agriculture used to grow food for humans).
More problematically, I think that the G&A accounting exercise varies conceptually from the exercise in the FAO study. One way to think about anthropogenic emissions is to consider the difference between what is produced and what would be produced in our absence. Another way to think about them is to consider the difference between what we produce and what we could produce under some concept of “best practices.” Considering options like removing cattle and using the lands for bio-fuels (which reduced the need for fossil fuels), and measuring emissions as the difference between the two clearly sits in the latter camp. However, this opens up the door to all kinds of extra considerations that the data from the FAO study does not directly deal with. For example, if the UK government spends a billion dollars on public health, the FAO figures would just use the GHG emissions arising from the various inputs. However, the billion could be spent on improving energy efficiency of existing buildings, and so if we want to include forgone opportunities (as G&A argue in favor of), the inputed emissions are higher than what is reflected in the CAIT figures used in the FAO study (which also form the starting point of the G&A analysis).
BTW, Gavin Schmidt over at realclimate.org has commented on the G&A analysis in various places and is quite dismissive. One of his points is that G&A double-count some sources. The bio-fuel example illustrates this. Saying that land could be used to grow biofuel and reduce the amount of fossil emissions doesn’t mean that actual emissions should be increased accordingly; instead, it implies that there is a counterfactual world where emissions are lower. It makes no sense to add these figures to actual figures, as G&A do, since the emissions that could be reduced are already accounted for in the underlying figures.
Thanks, I’ll review your comments and respond over the weekend.
Great work Paul. Evidence over theatre.
Thanks Bruce. McKibben needs to remove the blinkers and blindspots.