Archives for posts with tag: livestock

dreamstime_xs_39665629

Media outlets have recently reported that a new dietary additive for livestock could significantly reduce greenhouse gas emissions from beef and dairy production. [1] The reports were based on a study published in the Proceedings of the National Academy of Sciences. [2]

The chemical methane inhibitor, known as 3-nitrooxypropanol (3NOP), has been found to reduce methane emissions from the process of enteric fermentation within a cow’s digestive system by up to 30 percent.

Despite the beneficial finding, the potential reduction still leaves overall emissions from beef production on a different paradigm to those of alternative products.

There are two key reasons.

  • Firstly, methane emissions from enteric fermentation only represent a portion of the emissions from beef production, leaving many other sources that are unaffected by the change.
  • Secondly, apart from dairy cows, it may generally only be possible to apply the additive during a relatively short portion of many cows’ lives, and possibly not at all for those raised entirely on grass. For example, in Australia, the authors of a recent peer-reviewed paper wrote that “feed manipulation mitigation has low potential, because beef feedlots produce just 3.5% of enteric fermentation emissions”. [3]

The findings are only materially relevant to ruminant animals, and would appear to have little or no impact on emissions from products such as chicken or pig meat. (The Food and Agriculture Organization of the United Nations (FAO) has reported zero enteric fermentation emissions from chickens, and 3.1% from pigs). [4]

Figure 1 shows the estimated impact of the new additive on beef’s emissions intensity, assuming it were to become readily available with similar results to those found in the research study. (Emissions intensity represents the kilograms of carbon dioxide-equivalent, or CO2-e, greenhouse gases per kilogram of product.) The findings indicate that the 30 percent reduction in methane emissions achieved while consuming the inhibitor equates to a reduction of around 8.8 percent in overall emissions intensity for beef (94 kg compared to 83 kg).

Figure 1: Emissions intensity with and without 3NOP enteric methane inhibitor with GWP20 (kg CO2-e/kg product)

Emissions-intensity-beef-19-Sep-2015-V2

The results in Figure 1 are based on global average figures for:

  • the specialised beef herd;
  • the dairy herd; and
  • combined dairy and specialised beef

The figures vary by region, and are influenced by factors such as feed digestibility, livestock management practices, reproduction performance and land use.

The emissions intensity of beef from the dairy herd is lower than that of specialised beef. The main reason is that a large portion of the dairy herd’s emissions are attributed to dairy products, such as milk and cheese. The emissions from a dairy cow may be similar to those from a cow raised solely for beef, but the emissions per kilogram of product from a dairy cow are spread across a broader range of products than those from a cow in the specialised beef herd.

The emissions intensity of cow’s milk would reduce 18.5 percent, from 5.7 kilograms to 4.7 kilograms CO2-e per kilogram of product.

The figures are based on a twenty-year time horizon for determining the “global warming potential” (GWP) of the various greenhouse gases. Such a time frame, which more accurately reflects the shorter-term impacts of methane emissions, is critical when considering climate change tipping points, with potentially catastrophic and irreversible impacts.

For the purpose of the calculations, it is assumed it would be possible, using the 3NOP inhibitor, to influence the following percentages of the enteric fermentation emissions that would otherwise have applied:

  • Specialised beef (mixed feeding systems): 50 percent
  • Specialised beef (grazing systems): Nil
  • Dairy beef (mixed feeding systems): 100 percent
  • Dairy beef (grazing systems): Nil

The extent of the inhibitor’s influence was determined to be the product of the 30 percent figure reported by the researchers, and the relevant percentages shown above, weighted by production levels.

Although cows in mixed feeding systems within the specialised beef herd generally only spend the final 10 to 25 percent of their lives in feedlots, they reach their maximum size (and greenhouse gas-emitting capacity) during that period.

The figure of 50 percent has been arrived at after considering typical weights and feeding periods from North American production systems, where the use of feedlots is more prominent than in a country such as Australia. [5] [6] Even then, the figure of 50 percent is at the high end of the likely range, thereby potentially overstating the benefit of the inhibitor. That is a conservative approach in the context of this article’s message, which is that the inhibitor’s benefits are not as significant as may have been assumed from initial media reports. On the other hand, the inhibitor was found to increase body weight gain, which would contribute to a reduction in emissions intensity.

As indicated, a figure of 100 percent has been assumed for cows in mixed feeding systems within the dairy herd, where production infrastructure may provide greater opportunities than in the specialised beef herd to apply the inhibitor. That assumes that the animals can receive mainly non-grain feed such as hay and alfalfa for extended periods, as they have not evolved to eat grains, and would only survive on them for a limited time. The researchers have reported that the inhibitor needs to be delivered continuously into the cow’s rumen in order to be effective, meaning it would need to be mixed with the daily allotment of feed. The researchers stated: “If delivered as a pulse-dose, the inhibitory effect will likely be transient.”

The figures have been adapted from emissions intensity and production figures published by the FAO in 2013. [7] The emissions intensity figures are based on the global average percentage apportionment of the various contributing factors, and are intended to be approximations only.

Figure 2 indicates how different types of beef, with the benefit of the 3NOP inhibitor, compare to some plant-based alternatives. The emissions intensity figures for the latter are from a 2014 Oxford University study. [8] Of note is the fact that soy beans contain nearly 50 percent more protein than beef per kilogram. [9]

Figure 2: Emissions intensity of beef with 3NOP enteric methane inhibitor relative to plant-based options with GWP20 (kg CO2-e/kg product)

Emissions-intensity-19-Sep-2015-plants-V2

Figures 3 and 4 show the kilograms of carbon dioxide-equivalent greenhouse gas emissions from 1 kilogram of beef, with and without the 3NOP enteric methane inhibitor. Firstly, without the inhibitor:

Figure 3: kg of CO2-e emissions per kg of beef without 3NOP enteric methane inhibitor (global ave. incl. dairy herd beef based on 20-year GWP)

Slide13

Secondly, with the inhibitor:

Figure 4: kg of CO2-e emissions per kg of beef with 3NOP enteric methane inhibitor (global ave. incl. dairy herd beef based on 20-year GWP)

Slide12

Conclusion

Attempts at reducing methane emissions from livestock receive significant attention, but little is said by mainstream media or environmental groups about the far more effective option of reducing meat consumption. If we are serious about addressing climate change, then that is an essential measure.

Author

Paul Mahony (also on Twitter, Scribd, Slideshare and Viva la Vegan)

References

[1] Gray, D., “Diet change cuts methane emissions in cow burps”, The Age, 4th August, 2015, http://www.theage.com.au/victoria/diet-change-cuts-methane-emissions-in-cow-burps-20150804-girf6l.html

[2] Hristov, A.N., Oh, J., Giallongo, F., Frederick, T.W., Harper, M.T., Weeks, H.L., Branco, A.F., Moate, P.J., Deighton, M.H., Williams, S.R.O., Kindermann, M., Duval, S., An inhibitor persistently decreased enteric methane emission from dairy cows with no negative effect on milk production“, Proceedings of the National Academy of Sciences, PNAS 2015 ; published ahead of print July 30, 2015, doi:10.1073/pnas.1504124112, http://www.pnas.org/content/early/2015/07/29/1504124112.full.pdf

[3] Wedderburn-Bisshop, G., Longmire, A., Rickards, L., “Neglected Transformational Responses: Implications of Excluding Short Lived Emissions and Near Term Projections in Greenhouse Gas Accounting”, International Journal of Climate Change: Impacts and Responses, Volume 7, Issue 3, September 2015, pp.11-27. Article: Print (Spiral Bound). Published Online: August 17, 2015, http://ijc.cgpublisher.com/product/pub.185/prod.269

[4] Food and Agriculture Organization of the United Nations, “Tackling climate change through livestock: A global assessment of  emissions and mitigation opportunities”, Nov 2013, Figure 18, p. 35 and Figure 20, p. 37, http://www.fao.org/ag/againfo/resources/en/publications/tackling_climate_change/index.htm; http://www.fao.org/docrep/018/i3437e/i3437e.pdf

[5] Ontario Ministry of Agriculture, Food and Rural Affairs, “Typical Beef Feedlot and Background Diets – Factsheet”, March, 2006, http://www.omafra.gov.on.ca/english/livestock/beef/facts/06-017.htm

[6] Goodman, R., Agriculture Proud, “Ask A Farmer: What do feedlot cattle eat?”, 9th October, 2012, http://agricultureproud.com/2012/10/09/ask-a-farmer-what-do-feedlot-cattle-eat/

[7] Food and Agriculture Organization of the United Nations, op cit., Figure 7 and Table 5, p. 24

[8] Scarborough, P., Appleby, P.N., Mizdrak, A., Briggs, A.D.M., Travis, R.C., Bradbury, K.E., & Key, T.J., “Dietary greenhouse gas emissions of meat-eaters, fish-eaters, vegetarians and vegans in the UK”, Climatic Change, DOI 10.1007/s10584-014-1169-1, http://link.springer.com/article/10.1007%2Fs10584-014-1169-1

[9] USDA National Nutrient Database for Standard Reference at http://ndb.nal.usda.gov/ via Nutrition Data at http://www.nutritiondata.com

Image:

Dairy Cows Photo © Nengloveyou | Dreamstime.com

Australia-burger-2b

A paper by Wiedemann, et al., funded and promoted by Meat and Livestock Australia, was recently published in the journal Agricultural Systems. [1] [2] It reported on the performance of Australia’s beef industry in relation to greenhouse gas emissions and its efficiency in terms of water use, fossil fuel energy demand and land occupation. This post focuses on greenhouse gas emissions.

The paper reported that the greenhouse gas emissions intensity of Australian beef production had reduced 14 percent between 1981 and 2010. The reported reduction was from 15.3 kg to 13.1 kg of CO2-equivalent greenhouse gases per kilogram of live weight (kg CO2-e/kg live weight). Emissions intensity is a measure of the kilograms of carbon dioxide equivalent (CO2-e) greenhouse gases per kilogram of end “product” (in this case the live animal).

Both of the reported figures are low relative to other studies. Although low figures and improvements over time are pleasing, the results may not be as positive as they seem.

Background

The Wiedemann paper was based on a life cycle assessment of Australian beef production, covering processes and inputs from “cradle to farm gate”, immediately prior to “processing”. It excluded beef from dairy cattle and the live export trade.

It is assumed dairy cattle were excluded due to the fact that their emissions are attributed to dairy products in addition to beef, which is a key reason for beef-related emissions from dairy cattle being far lower than those from the specialised beef herd.

The authors were not in a position to collect data on the final stages of live export animals.

Factors considered in the report

Emissions factors considered in the study included methane from enteric fermentation in the digestive system of ruminant animals; nitrous oxide and methane from manure management; carbon dioxide from fossil fuels; land clearing (deforestation) to promote pasture growth; and soil carbon losses from various sources.

Comparison with other emissions intensity assessments

Many assessments of greenhouse gas emissions intensity of food products have been conducted. In terms of Australian beef, perhaps the most recent reports suitable for comparison were published by the Food and Agriculture Organization of the United Nations (FAO) in November, 2013.

The FAO reports were based on findings from life cycle assessments using its Global Livestock Environmental Assessment Model (GLEAM). The model takes into account emissions along the supply chain to the retail point. It reported that “post-farm” emissions represented only 0.5 percent of beef’s global average emissions intensity. As those emissions were relatively minor, the FAO studies would seem to be a reasonable comparison with Wiedemann’s.

Although not specifically reporting on Australian beef, the FAO did report on Oceania, of which Australia and New Zealand are the major beef-producing nations. In 2010, Australia produced around 2.3 million tonnes of beef, with New Zealand’s output equivalent to just over a quarter of that figure. Excluding beef from the dairy herd (consistent with the Wiedemann study), New Zealand’s relative output may be significantly lower than indicated by those figures.

The FAO’s estimate of emissions intensity of specialised beef in Oceania was approximately 36 kg CO2-e/kg product (carcass weight), based on a 100-year GWP (refer below). [3] That was an overall figure based on animals from grazing and mixed feeding systems. The emissions intensity of beef from animals raised solely on grass would be far higher than that of animals raised on both grass and grain. (Although land clearing rates and related timing differences may account for some of the difference between the FAO’s Oceania figure and the Wiedemann study’s results, those land clearing rates are again increasing, as referred to below.)

The FAO’s global average figure for specialised beef was 67.6 kg, noting that feed digestibility, weight and age at slaughter, and the extent of land clearing are contributing factors. Its figure for beef from grass-fed animals was 102.2 kg, and from animals raised on a combination of grass and grain, 56.2 kg. [4] Those figures are based on a 100-year GWP and would be higher if a 20-year GWP had been utilised (as referred to below).

A 2003 “end use” report commissioned by the Australian Greenhouse Office (using a 100-year GWP) estimated an overall figure for Australian beef of 51.7 kg CO2-e/kg product for the 1999 reference period and up to 79.9 kg for earlier periods. [5]

Here’s a snapshot of the comparisons:

Figure 1: Comparative Emissions Intensities of Beef (showing relevant reference period)

Comarative-emissions-intensity

Alternative methodologies would appear to account for some of the differences between Wiedemann’s findings and those from other reports, as Wiedemann and co-authors indicated a relatively low figure for each of their reference periods, being 1981 and 2010.

The approach to measuring emissions from enteric fermentation would almost certainly account for some of the difference. Enteric fermentation is the process that occurs in the digestive systems of ruminant animals, producing methane, an extremely potent greenhouse gas. For the northern cattle heard consuming tropical feed, the authors based their emissions intensity figure on a 2011 study by Kennedy and Charmley, who estimated methane emissions 30 percent lower than those used in the National Greenhouse Gas Inventory (NGGI). [6] That approach is likely to be adopted for the 2015 NGGI, reporting on 2013 emissions. [7]

However, alternative approaches to calculating methane’s impact are unlikely to account for the significant differences between the Wiedemann report and other analyses, as it represents thirty percent of one part (the northern cattle herd) of one factor (methane from enteric fermentation) amongst several.

Some concerns with the Wiedemann paper

Out of date “global warming potential” (GWP)

The emissions of different greenhouse gases can be aggregated by converting them to carbon dioxide equivalents (CO2-e). It is analogous to converting several different currencies to a common denomination. The greenhouse gases are converted by multiplying the mass of emissions by the appropriate “global warming potentials” (GWPs), which represent their warming effect relative to CO2. (For more details, please see my page GWP Explained.)

The GWP used by the paper’s authors for methane was already out of date when the paper was originally submitted to the journal for consideration in July 2014, and even further out of date when a revised version was submitted in November that year. The IPCC (Intergovernmental Panel on Climate Change) used a GWP multiplier of 25 in 2007 until it increased it to 34 (with climate-carbon feedbacks) and 28 (without those feedbacks) in its 2013 Fifth Assessment Report. [8] If updated methane and nitrous oxide figures (including climate-carbon feedbacks) had been used, beef’s emissions intensity would have been around 20 percent higher than reported, at 15.7 kg CO2-e/kg live weight.

Please also see comments below regarding a 20-year GWP.

Live weight versus carcass weight

The study is unusual to the extent that it bases its emissions intensity figures on live weight of the animal, rather than carcass weight or weight of the end product.

If we use the same adjustment factor for converting from live weight to carcass weight as was used in a report cited in the Wiedemann paper, then the emissions intensity would increase to 19.0 CO2-e/kg carcass weight. [9]

20-year GWP should also be considered

A time horizon of 100 years is commonly used in applying GWPs, and that was the case with this paper. That time horizon may not be appropriate when considering livestock’s climate change impacts, as methane breaks down to a significant extent within twelve years of being released.

In its Fifth Assessment Report, the Intergovernmental Panel on Climate Change (IPCC) acknowledged that the 100-year figure is not always appropriate by stating:

“There is no scientific argument for selecting 100 years compared with other choices. The choice of time horizon is a value judgement because it depends on the relative weight assigned to effects at different times.” [10]

On the basis of carcass weight and a 20-year GWP for methane and nitrous oxide, the emissions intensity in this case would have been 36.9 kg CO2-e/kg live weight, without allowing for additional factors referred to below.

Figure 2: Alternative measures of beef’s emissions based on Wiedemann paper along with certain plant-based options

Image-4

As another comparison, the FAO’s figures (referred to above) would increase as indicated below.

Figure 3: FAO Emissions Intensity figures GWP100 vs GWP20

GWP100-GWP20

The “20-year GWP” figures in Figures 2 and 3 are based on the global average percentage split of the various factors contributing to beef’s emissions intensity, and are intended to be approximations only. As methane’s percentage contribution would be lower in mixed systems than in grazing systems, the figure of 114.9 kg in Figure 3 may be overstated, while the figure of 208.9 kg may be understated.

Allowing for the FAO’s estimate for Oceania (which is dominated by the Australian beef industry) gives us the following comparison with figures based on the Wiedemann study and some plant-based alternatives, as shown above.

Figure 4: Alternative measures of beef’s emissions based on Wiedemann paper and FAO along with certain plant-based options

Image-4-fao-added

Livestock-related land clearing is increasing

In promoting the Wiedemann paper, MLA reported that a reduction in emissions from land use “reflects the ban on broad scale clearing in Queensland”. [2] Unfortunately, due to exemptions and possible illegal clearing, livestock-related land clearing did not cease after the so-called ban (introduced by the previous Labor government) commenced in December, 2006.

In any event, the relevant legislation was overturned by the Liberal National government in 2013 in respect of land deemed to be of “high agricultural value”. [11] Even with the ban in place, extensive clearing for pasture occurred, including an estimated 134,000 hectares in 2011/12. [12]

The government changed to Labor again in early 2015, but it seems unwilling to revert to its earlier “ban”. The Minister for Natural Resources and Mines has said [13]:

“It is business as usual for landholders under Queensland’s vegetation management regulatory framework. I want to assure landholders and industry that current vegetation management practices remain in operation and there will be no rushed changes to the Vegetation Management Act 1999.”

A forthcoming report from the Statewide Landcover and Trees Study (SLATS) is expected to indicate a figure of 275,000 hectares for 2013/14, which represents more than a tripling since 2009/10, when around 77,000 hectares were cleared. [14] [15]

Figure 5: Queensland land clearing 1995 – 2014

History-Qld-clearing

A report by the World Wildlife Fund has identified eastern Australia as one of eleven global “deforestation fronts” for the twenty years to 2030. It has stated: [16]

“A weakening of laws to control deforestation in Queensland and New South Wales could bring a resurgence of large-scale forest clearing, mainly for livestock farming.”

The Wiedemann paper allowed for average annual beef-related clearing of around 158,000 hectares in Queensland for the five years to 2010. That appears to be a reasonable estimate for that period, but may be understated in terms of future clearing.

The paper’s supplementary material (Table A12) indicated that over 8 million hectares (80,000 square kilometres) were cleared for beef production in Queensland from 1981 to 2010. (The figures shown in the table are the annual average per five-year period.)

The forests will always be at risk of further clearing, depending largely on the inclination of the government of the day. The recently signed free trade agreement with China may be a key factor in further acceleration of livestock-related land clearing.

Savanna burning omitted

The Wiedemann study ignores savanna burning in relation to livestock production, supporting the view expressed in the National Greenhouse Gas Inventory that the burning would occur naturally if not instigated by graziers. (The 2010 National Greenhouse Inventory attributed 10.8 percent of agriculture’s emissions to savanna burning.)

However, that position is not supported by climate change campaign group Beyond Zero Emissions and Melbourne Sustainable Society Institute (University of Melbourne), who have stated [17]:

“This position was based on largely anecdotal evidence that Aboriginal ‘firestick farming’ was extensively practiced prior to colonisation. Instead substantial expert opinion supports the conclusion that these emissions, categorised under Prescribed burning of Savannas, are anthropogenic. There is also evidence that savanna fires are far more widespread and frequent than would naturally occur.”

The Pew Charitable Trusts have also commented extensively on the destructive environmental impacts of livestock grazing, including  manipulation of fire regimes (along with tree clearing, introduction of invasive pasture grasses, and degradation of land and natural water sources). [18]

Foregone sequestration omitted

The report’s authors did not consider foregone sequestration, despite the fact that livestock production has been responsible for around 70 percent of clearing in Australia. [19]. That is, they did not allow for the fact that current atmospheric carbon concentrations are far higher than they would have been if forest and other wooded vegetation had been retained, removing carbon from the atmosphere.

That approach is consistent with official emissions estimates, but they all contribute to society failing to clearly identify significant causes of climate change and relevant mitigation opportunities.

What many of us assume to be natural landscapes may be very different to what existed before livestock and other pressures were introduced. The problem is highlighted in the following words from Australia’s Commonwealth Scientific and Industrial Organisation [20]:

“It was once possible to walk from Melbourne to Sydney through almost continuous woodland cover, but now much of it is gone and the remaining patches are small and highly disturbed.”

Short-lived global warming agents omitted

Two warming agents generally omitted from official figures, and also from the Wiedemann paper, are tropospheric ozone and black carbon. They remain in the atmosphere for a short period, but have a significant impact.

Tropospheric ozone is formed through a series of chemical reactions involving nitrogen oxide, methane, carbon monoxide and other non-methane volatile organic compounds. It is the third most prevalent greenhouse gas after carbon dioxide and methane (not allowing for water vapour). Major sources of carbon monoxide are agricultural waste burning, savanna burning and deforestation.

In its fifth assessment report, the IPCC stated, “there is robust evidence that tropospheric ozone also has a detrimental impact on vegetation physiology, and therefore on its CO2 uptake”. [21]

Black carbon is a microscopic particulate that is formed through the incomplete combustion of fossil fuels, biofuels and biomass. The greatest single sources are savanna and forest fires, with livestock production playing a key role.

Black carbon contributes to global warming in two ways. Firstly, the particulates create heat by absorbing the sun’s radiation while airborne. Secondly, they can blow thousands of kilometres to land on glaciers and polar ice caps, where they cause solar radiation to be absorbed, rather than reflected, thereby speeding melting.

The Wiedemann paper’s approach on savanna burning, as referred to above, may be a factor in omitting the impact of tropospheric ozone and black carbon.

Soil carbon losses may be understated

The Wiedemann study considered loss of soil carbon arising from “cultivation for feed grain or fodder production, associated with land management and the conversion of pasture to crop land”.

Other relevant soil carbon emissions are not allowed for in official figures, and do not appear to have been considered in the Wiedemann paper.

Beyond Zero Emissions and Melbourne Sustainable Society Institute have highlighted the significant loss of soil carbon due to wind and water erosion that is “greatly accelerated by the removal and disturbance of vegetation”. They have reported that 80 percent of Australia’s soil organic carbon loss comes from rangeland grazing areas, highlighting the impact of rangeland deforestation and degradation. [22]

Conclusion

Despite the Wiedemann paper indicating relatively favourable results for Australian beef production’s greenhouse gas emissions, the material presented here indicates that beef’s performance is extremely poor (with emissions intensity figures more than ten times those of plant-based alternatives) after allowing for various additional factors. We must take those factors into account if we are to address the threat of climate change (including the essential mitigation measures) with the focus and urgency required.

Author

Paul Mahony (also on Twitter, Scribd, Slideshare and Viva la Vegan)

Note

The Wiedemann paper appears to contain two errors, which seem immaterial but may still be worth mentioning. Firstly, a reference of “DCCEE, 2010″ (the National Greenhouse Gas Inventory for 2008) was used on page 112, when it should have been “DCCEE 2012″ (the National Greenhouse Gas Inventory for 2010). Secondly, emissions from the beef herd were reported in gigagrams on page 113, when they should almost certainly have been megatonnes. (1 megatonne equals 1,000 gigagrams.)

Update 4th July, 2015

Comments on short-lived global warming agents and soil carbon losses added.

References

[1] Wiedemann, S.G, Henry, B.K., McGahan, E.J., Grant, T., Murphy, C.M., Niethe, G., “Resource use and greenhouse gas intensity of Australian beef production: 1981–2010″, Agricultural Systems, Volume 133, February 2015, Pages 109–118, http://www.sciencedirect.com/science/article/pii/S0308521X14001565 and http://ac.els-cdn.com/S0308521X14001565/1-s2.0-S0308521X14001565-main.pdf?_tid=e4c5d55e-fc16-11e4-97e1-00000aacb362&acdnat=1431813778_b7516f07332614cd8592935ec43d16fd

[2] Meat & Livestock Australia, “Australian beef industry reduces environmental footprint over 30 years”, 26th March 2015, http://www.mla.com.au/About-MLA/News-and-media/Media-releases/Australian-beef-industry-reduces-environmental-footprint-over-30-years and Target 100, “Australian beef and environmental impact: 30 years of progress and innovation” (© 2012 – 2014 Meat & Livestock Australia Limited), undated (accessed 29th June, 2015), http://www.target100.com.au/Hungry-for-Info/Target-100-Responds/Australian-beef-and-environmental-impact-30-years-of-progress-and-innovation

[3] Food and Agriculture Organization of the United Nations, “Greenhouse gas emissions from ruminant supply chains: A global life cycle assessment”, Figure 12, p. 30, Nov 2013, http://www.fao.org/ag/againfo/resources/en/publications/tackling_climate_change/index.htm; http://www.fao.org/docrep/018/i3461e/i3461e.pdf

[4] Food and Agriculture Organization of the United Nations, “Tackling climate change through livestock: A global assessment of  emissions and mitigation opportunities”, Nov 2013, Table 5, p. 24, http://www.fao.org/ag/againfo/resources/en/publications/tackling_climate_change/index.htm; http://www.fao.org/docrep/018/i3437e/i3437e.pdf

[5] George Wilkenfeld & Associates Pty Ltd and Energy Strategies, National Greenhouse Gas Inventory 1990, 1995, 1999, End Use Allocation of Emissions Report to the Australian Greenhouse Office, 2003, Volume 1″, Table S5, p. vii.

[6] Kennedy P. M., Charmley E. (2012) “Methane yields from Brahman cattle fed tropical grasses and legumes”, Animal Production Science 52, 225–239, http://dx.doi.org/10.1071/AN11103

[7] Australian National Greenhouse Accounts, National Inventory Report 2012, Volume 1, p. 275

[8] Myhre, G., D. Shindell, F.-M. Bréon, W. Collins, J. Fuglestvedt, J. Huang, D. Koch, J.-F. Lamarque, D. Lee, B. Mendoza, T. Nakajima, A. Robock, G. Stephens, T. Takemura and H. Zhang, 2013: “Anthropogenic and Natural Radiative Forcing. In: Climate Change 2013: The Physical Science Basis. Contribution of Working Group 1 to the Fifth Assessment Report of the Intergovernmental Panel on Climate Change” , Table 8.7, p. 714 [Stocker, T.F., D. Qin, G.-K. Plattner, M. Tignor, S.K. Allen, J. Boschung, A. Nauels, Y. Xia, V. Bex and P.M. Midgley (eds.)]. Cambridge University Press, Cambridge, United Kingdom and New York, NY, USA, http://www.ipcc.ch/report/ar5/wg1/

[9] Capper, J., 2011. The environmental impact of beef production in the United States: 1977 compared with 2007. J. Anim. Sci. 89 (12), 4249–4261. Cited in Wiedemman, et al., op cit.

[10] Myhre, G, op cit., p. 711-712

[11] Roberts, G, “Campbell Newman’s LNP bulldozing pre-election promise”, The Australian, 1 June, 2013, http://sunshinecoastbirds.blogspot.com.au/2013/06/campbell-newman-takes-axe-to-queensland.html

[12] Queensland Department of Science, Information Technology, Innovation and the Arts. 2014. Land cover change in Queensland 2011–12: a Statewide Landcover and Trees Study (SLATS) report. DSITIA, Brisbane, Table 4, p. 28, https://www.qld.gov.au/environment/land/vegetation/mapping/slats-reports/

[13] Queensland Government, Minister for State Development and Minister for Natural Resources and Mines, Media Statement, “Vegetation management business as usual”, 5th March 2015, http://statements.qld.gov.au/Statement/2015/3/5/vegetation-management-business-as-usual

[14] Maron, M., Laurance, W., Pressey, R., Catterall, C.P., Watson, J., Rhodes, J., “Land clearing in Queensland triples after policy ping pong”, The Conversation, 18th March, 2015 https://theconversation.com/land-clearing-in-queensland-triples-after-policy-ping-pong-38279

[15] Phelps, M., “Drought drives mulga hunger”, Queensland Country Life, 23rd February, 2015, http://www.queenslandcountrylife.com.au/news/agriculture/general/healthcare/drought-drives-mulga-hunger/2724451.aspx?storypage=0, cited in Maron, et al., op cit.

[16] World Wildlife Fund, “WWF Living Forests Report”, Chapter 5 and Chapter 5 Executive Summary, http://d2ouvy59p0dg6k.cloudfront.net/downloads/lfr_chapter_5_executive_summary_final.pdf; http://d2ouvy59p0dg6k.cloudfront.net/downloads/living_forests_report_chapter_5_1.pdf

[17] Beyond Zero Emissions and Melbourne Sustainable Society Institute of The University of Melbourne, “Zero Carbon Australia – Land Use: Agriculture and Forestry – Discussion Paper”, October, 2014, p. 90, http://bze.org.au/landuse

[18] Woinarski, J., Traill, B., Booth, C., “The Modern Outback: Nature, people, and the future of remote Australia”, The Pew Charitable Trusts, October 2014, p. 167-171 http://www.pewtrusts.org/en/research-and-analysis/reports/2014/10/the-modern-outback

[19] Derived from Russell, G. “The global food system and climate change – Part 1”, 9 Oct 2008, http://bravenewclimate.com/2008/10/09/the-global-food-system-and-climate-change-part-i/, which utilised: Dept. of Sustainability, Environment, Water, Population and Communities, State of the Environment Report 2006, Indicator: LD-01 The proportion and area of native vegetation and changes over time, March 2009; and ABS, 4613.0 “Australia’s Environment: Issues and Trends”, Jan 2010; and ABS 1301.0 Australian Year Book 2008, since updated for 2009-10, 16.13 Area of crops.

[20] Lindenmayer, D. and Burgman, M., “Practical Conservation Biology” (2005, CSIRO Publishing), p. 235, http://www.publish.csiro.au/onborrowedtime/docs/PCB_Ch09.pdf and http://www.publish.csiro.au/pid/5034.htm

[21] Myhre, G, et al., op cit., p. 661

[22] Beyond Zero Emissions and Melbourne Sustainable Society Institute of The University of Melbourne, op cit., pp. 47-48

Images

Australian map | Creative Commons Attribution 2.0 | colorkiddo.com

Big burger © Boltenkoff | Dreamstime.com

Figure 5 is from Maron, M., et al., op cit. (Ref. 14)

Harissa-bean-tagine-2

Have you ever wondered about the climate change impacts of a single meal?

Food production significantly affects climate change, so let’s consider how adding ingredients to an existing recipe can affect the relevant greenhouse gas emissions. The recipe in this instance (for four people) is Harissa Bean Tagine, from The Kind Cook. [1]

In its original form, based primarily on emissions intensity figures from the Food and Agriculture Organization of the United Nations (FAO), the recipe’s ingredients are estimated to produce 2.3 kg of carbon dioxide-equivalent greenhouse gases.

The chart below shows the revised emissions after adding 250 grams (just over half a pound) of various ingredients and adjusting the FAO’s figures to allow for a 20-year time horizon in assessing the impact of methane and nitrous oxide. [2] [3] [Footnote]

Two global average figures are shown for beef; grass-fed and “mixed-fed”. Beef from grass-fed cows is far more emissions intensive than beef from mixed feeding systems, involving grain and grass. No cows are fed grain exclusively for their entire lives, as they have not evolved to consume it and would not survive. “Grain-fed” cows are usually “finished” on grain for up to 120 days prior to slaughter, and the chart refers to the meat as “mixed-fed”.

For Oceania, the FAO only provided an overall figure, combining grass-fed and mixed-fed systems. Australia and New Zealand are the major beef-producing nations within Oceania. In 2013, Australia produced around 2.5 million tonnes of beef, with New Zealand’s output equivalent to less than a quarter of that figure. [4] Excluding beef from the dairy herd, New Zealand’s relative output may be significantly lower than indicated by those figures.

The emissions intensity figures for beef are for specialised beef, excluding meat from dairy cows, whose emissions are also attributed to dairy products.

The figures for fish and tofu are from a 2014 study by Oxford University. As processing accounts for a relatively small portion of a product’s emissions, the figure for tofu is based on the results for soy. [5]

Figure 1: “Harissa Bean Tagine” – kg of greenhouse gas emissions with the addition of new ingredients

Harissa-emissions

What about pork, chicken and fish?

There are two key reason for the relatively low emissions from pork, chicken and fish, although it should be noted that emissions relating to any type of food can vary widely, depending on the methods and conditions involved.

Firstly, the animals involved are not ruminants, and therefore do not produce methane to the same extent as, say, cows and sheep. Methane is a potent greenhouse gas.

Secondly, unlike cows and sheep, they do not graze on pasture as part of the production process. That means that a relatively small land area has been cleared for products derived from them. Deforestation, regular burning of savanna to promote new grass and prevent forest from regenerating, and grazing on natural pasture, emit carbon dioxide and other greenhouse gases.

Unfortunately, even the emissions figures for beef and lamb do not include foregone sequestration. That is, they do not allow for the fact that current atmospheric carbon concentrations are far higher than they would have been if forest and other wooded vegetation had been retained, removing carbon from the atmosphere.

What many of us assume to be natural landscapes may be very different to what existed before livestock (the major cause of clearing) and other pressures were introduced. The problem is highlighted in the following words from Australia’s Commonwealth Scientific and Industrial Organisation [6]:

“It was once possible to walk from Melbourne to Sydney through almost continuous woodland cover, but now much of it is gone and the remaining patches are small and highly disturbed.”

A major contributor to deforestation in the Amazon and Cerrado regions of South America is conversion of forest and other wooded vegetation to soy bean plantations. Most of the world’s soy is fed to livestock, including nearly 500 million pigs in China, in an inherently and grossly inefficient system of producing nutrition for the world’s human population. [7] [8]

Those inefficiencies are a key factor in other critical environmental problems involved in producing food from animals, resulting in the over-use of resources (such as land, fertiliser, pesticides and fossil fuels), the creation of waste, and the destruction of oceanic ecosystems far in excess of what would occur if our nutrition was derived directly from plants.

Adequacy of Alternative Diets

The American Dietetic Association has said [9]:

“It is the position of the American Dietetic Association that appropriately planned vegetarian diets, including total vegetarian or vegan diets, are healthful, nutritionally adequate, and may provide health benefits in the prevention and treatment of certain diseases. Well-planned vegetarian diets are appropriate for individuals during all stages of the life cycle, including pregnancy, lactation, infancy, childhood, and adolescence, and for athletes. A vegetarian diet is defined as one that does not include meat (including fowl) or seafood, or products containing those foods.”

As the extent of fortification of foods with nutrients such as vitamin B12 and vitamin D varies by country, it is important to review the adequacy of your diet based on local conditions.

In respect of vitamin D, The Medical Journal of Australia has reported: [10]

“Most adults are unlikely to obtain more than 5%-10% of their vitamin D requirement from dietary sources. The main source of vitamin D for people residing in Australia and New Zealand is exposure to sunlight.”

The vitamin B12 found in certain animal-based food products is produced by soil microbes that live in symbiotic relationships with plant roots, and which find their way into the animals’ digestive tracts. Such bacteria are also found in humans’ digestive tracts, but too far along to be readily absorbed for nutritional purposes. [11]

Vitamin B12 is not synthesised by plants, nor is it generally found on vegetables in our modern sanitised lifestyle. However, B12 supplements are readily produced from bacteria, to be ingested directly or incorporated in various other food products. That is a far more natural approach than: (a) destroying rainforests and other natural environs; and (b) operating livestock production systems; purely for animal food products.

The Oxford Dictionary defines the word “natural” to mean: Existing in or derived from nature; not made or caused by humankind”. On the basis of that definition, no livestock production systems could be described as “natural”. Even so-called “free range” systems involve factors such as selective and intense breeding programs, premature death, and often mutilation, such as ear-notching and castration.

Conclusion

To encourage dietary practices that have the most beneficial impact on climate change, governments need to introduce policies that establish pricing signals incorporating the environmental costs of different products. With such policies, beef and certain other products would become luxury items, with reductions in demand, production and the resultant environmental impacts.

Author

Paul Mahony (also on Twitter, Facebook, Scribd, Slideshare, New Matilda, Rabble and Viva la Vegan)

Footnote

If you would like more information about using a 20-year time horizon for assessing greenhouse gas emissions, please see my page GWP Explained.

Please Note

None of the information contained in this article is intended to represent nutritional, dietary, medical, health or similar advice.

Recipe for Harrisa Bean Tagine from The Kind Cook

Harissa is a hot paste from Tunisia (North Africa), made from chilli, herbs and spices. Traditionally cooked in a tagine, this dish can also be done by gently cooking on your stove top. Choose good quality chopped tomatoes and go easy on the harissa paste if you are not great with chilli.

This is such a simple, uncomplicated, warming, economical and nourishing dish. Loads of fresh herbs lift its earthy notes.

YOU NEED

Oil for cooking

1 large brown onion, peeled and finely diced

4 cloves of garlic, peeled and minced

2 x 400 gram cans chopped tomatoes

1 – 1.5 teaspoons of harissa paste

2 teaspoons of pure maple syrup

2 cans cannellini beans, rinsed well and drained

1 cup of fresh parsley, washed well and roughly chopped

1 bunch of fresh coriander, washed well, stems finely diced, leaves roughly chopped

1/2 teaspoon salt/cracked black pepper

#optional – 1 teaspoon of dried chilli

YOU DO

Heat a small amount of oil in a large pan. Alternatively just use a little water and sauté the onion until softened. Add the garlic and cook on a gentle heat for another minute or two.

Add the crushed chopped tomatoes, harissa paste and maple syrup. Stir to combine and simmer gently for 10 minutes.

Add the beans. Stir through the parsley and coriander. Bring everything to the boil.

Check the seasoning. Add some chilli flakes if you want more heat.

Serving suggestion: This is lovely served with cous cous, steamed maple carrots, loads of salad dressed in fresh lime juice and olive oil. Fresh bread to mop up all the juices is also a great accompaniment.

Yields: 4 small serves

Time: Takes about 30 minutes.

Notes: Harissa paste is available in well stocked delis.

I often also add a generous handful of good quality Kalamata olives to this dish, when I add the beans.

If you have left overs, this is delicious on toast the next day.

References

[1] The Kind Cook, http://thekindcook.com/; http://thekindcook.com/harissa-bean-tagine/ (Used with permission.) Also: https://www.facebook.com/thekindcook; http://twitter.com/TheKindCook; http://pinterest.com/thekindcook/; http://instagram.com/thekindcook/

[2] Food and Agriculture Organization of the United Nations, “Tackling climate change through livestock: A global assessment of emissions and mitigation opportunities”, Nov 2013, http://www.fao.org/ag/againfo/resources/en/publications/tackling_climate_change/index.htm; http://www.fao.org/docrep/018/i3437e/i3437e.pdf

[3] Food and Agriculture Organization of the United Nations, “Greenhouse gas emissions from ruminant supply chains: A global life cycle assessment”, Nov 2013, http://www.fao.org/ag/againfo/resources/en/publications/tackling_climate_change/index.htm; http://www.fao.org/docrep/018/i3461e/i3461e.pdf

[4] FAOSTAT, Livestock Primary, 2013, http://faostat.fao.org/site/569/DesktopDefault.aspx?PageID=569#ancor, accessed 27 June, 2015 (Actual numbers: Australia 2,480,458 tonnes; New Zealand 572,628 tonnes)

[5] Scarborough, P., Appleby, P.N., Mizdrak, A., Briggs, A.D.M., Travis, R.C., Bradbury, K.E., & Key, T.J., “Dietary greenhouse gas emissions of meat-eaters, fish-eaters, vegetarians and vegans in the UK, Climatic Change, DOI 10.1007/s10584-014-1169-1, http://link.springer.com/article/10.1007%2Fs10584-014-1169-1

[6] Lindenmayer, D. and Burgman, M., “Practical Conservation Biology” (2005, CSIRO Publishing), p. 235, http://www.publish.csiro.au/onborrowedtime/docs/PCB_Ch09.pdf and http://www.publish.csiro.au/pid/5034.htm

[7] FAOSTAT, Live Animals, 2012, http://faostat.fao.org/site/573/DesktopDefault.aspx?PageID=573#ancor, accessed 12 May, 2014. (Actual number: 471,875,000 of a global population of 966,170,968)

[8] Brown, L.R., “Full Planet, Empty Plates: The New Geopolitics of Food Scarcity, Chapter 9, China and the Soybean Challenge”, Earth Policy Institute, 6 November, 2013, http://www.earthpolicy.org/books/fpep/fpepch9

[9] Craig, W.J., Mangels, A.R., American Dietetic Association, “Position of the American Dietetic Association: vegetarian diets.”, J Am Diet Assoc. 2009 Jul;109(7):1266-82, http://www.ncbi.nlm.nih.gov/pubmed/19562864

[10] Nowson, C.A., McGrath, J.J., Ebeling, P.R., Haikerwal, A., Daly, R.M., Sanders, K.M., Seibel, M.J. and Mason, R.S., “Vitamin D and health in adults in Australia and New Zealand: a position statement”, Med J Aust 2012; 196 (11): 686-687, doi: 10.5694/mja11.10301, https://www.mja.com.au/journal/2012/196/11/vitamin-d-and-health-adults-australia-and-new-zealand-position-statement

[11] Trafton, A., “MIT biologists solve vitamin puzzle”, MIT News, 21 March, 2007, http://newsoffice.mit.edu/2007/b12 and McDougall, J., “Vitamin B12 Deficiency—the Meat-eaters’ Last Stand”, McDougall Newsletter, Vol. 6, No. 11, Nov, 2007, https://www.drmcdougall.com/misc/2007nl/nov/b12.htm

???????????????????????????????????????????????????????????????????????????????????????????????????

Meat and Livestock Australia has published a series of study guides for primary and secondary school students.

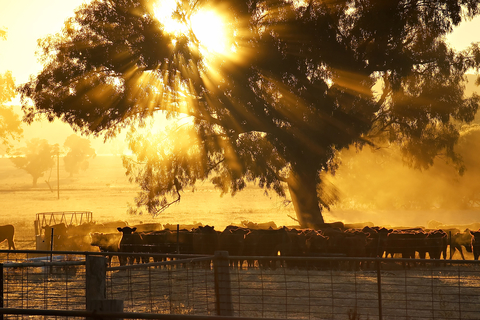
This post focuses on one of the primary school guides, “Cattle and the Environment”, released in 2010. [1] Copyright rules prevent me from showing images from the guide, but in my view, the above image (from elsewhere) gives some idea of the style.

As a general comment, I don’t feel that it’s asking too much to expect a study guide to be factual. If it’s not, could there be an ulterior motive?

Having said that, I anticipate that many kids studying this topic will be too astute to be brainwashed by industry PR.

Soils and vegetation

MLA Claim #1

“Although in the past some agricultural land was cleared, these days farmers understand the importance of balancing plant, animal, insect and bird life with agriculture.”

The reality

So in the past some agricultural land was cleared?

That’s an understatement.

Around 70 percent of Australia’s 7.7 million square kilometre land mass is arid or semi-arid, leaving 2.3 million square kilometres of reasonably fertile land. Against that background, it’s sobering to consider that we have cleared around 1 million square kilometres since European settlement, including around 700,000 square kilometres for animal agriculture, including meat, dairy and wool. [2]

In the 1990’s, Australia was the only country in the top 20 land-clearing nations with a developed first world economy. (We were ranked 6th.) Most clearing in recent decades has occurred in Queensland. In the early 2000s, if that state were a country, it would have ranked 9th in terms of land clearing. [3]

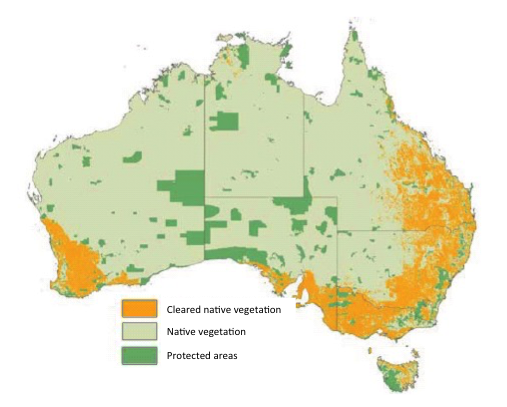
By converting forest and other wooded vegetation to grassland, we have lost an enormous sequestration (carbon absorption) benefit. Figure 1 gives some idea of our poor record, including clearing across most of Victoria (south-east corner of the mainland). [4]

Figure 1: Cleared native vegetation and protected areas in Australia

Slide01

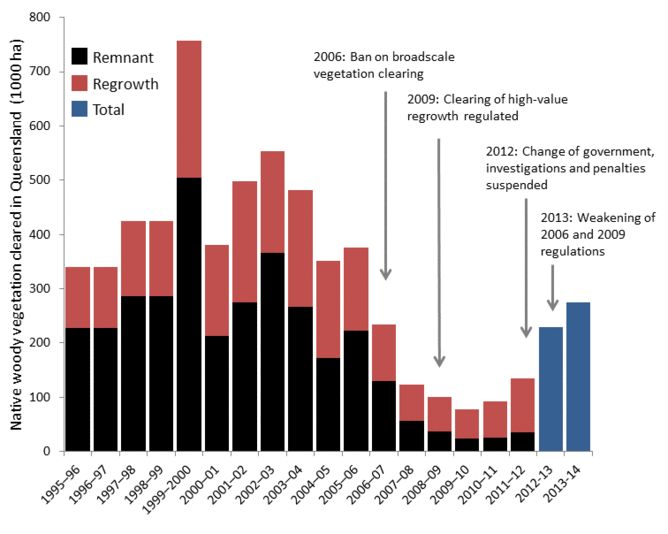
MLA’s statement almost seems to imply that clearing for animal agriculture has ceased. However legislation in Queensland that banned broad-scale land clearing (subject to exemptions) effective from December 2006 was overturned in 2013 in respect of land deemed to be of “high agricultural value”. [5]

Even with the previous so-called ban in place, extensive clearing for pasture occurred, including an estimated 134,000 hectares in 2011/12. [6] That equates to around 2.4 regular suburban house blocks per minute, for every minute of the year. [7]

Former principal scientist with the Queensland government, Gerard Wedderburn-Bisshop [Footnote 1], has confirmed in correspondence that over 95 percent of clearing within the “pasture” category of the government’s Statewide Landcover and Trees Study (SLATS) was estimated to be for cattle grazing.

The forests will always be at risk of further clearing, depending largely on the inclination of the government of the day. The recently signed free trade agreement with China is likely to increase pressure for further livestock-related land clearing.

Similar problems have been highlighted in the The Pew Charitable Trusts‘ October, 2014 publication, The Modern Outback: Nature, people, and the future of remote Australia, in which the authors commented extensively on the destructive environmental impacts of livestock grazing. [8] Problems include tree clearing, introduction of invasive pasture grasses, degradation of land and natural water sources, and manipulation of fire regimes (p. 167-171).

The authors highlighted the fact that the environment improves when pastoralists move away from intense grazing activity.

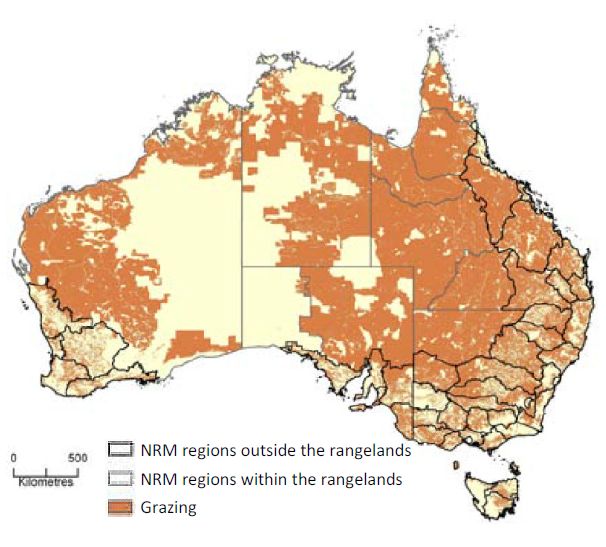
The sheer scale of grazing in this country is demonstrated in Figure 2. [9]

Figure 2: The location of grazing land in Australia in 2005-06 showing NRM (natural resource management) regions within and outside the rangelands. Source ABARE-BRS

Australian-grazing-lands

While grazing continues, former forest and other wooded vegetation is unable to regenerate.

Without massive reforestation aimed at drawing down existing atmospheric carbon, the world’s pre-eminent climate scientist, Dr James Hansen and co-authors, say we will not return to CO2 concentrations of 350 parts per million (ppm), which is (in their view) a pre-requisite for overcoming the threat of climate change. [10]

The issue was also highlighted in a 2009 report from the PBL Netherlands Environmental Assessment Agency in which the authors stated:

“. . . a global food transition to less meat, or even a complete switch to plant-based protein food [was found] to have a dramatic effect on land use. Up to 2,700 Mha of pasture and 100 Mha of cropland could be abandoned, resulting in a large carbon uptake from regrowing vegetation. Additionally, methane and nitrous oxide emissions would be reduced substantially. [11]

They said a plant-based diet would reduce climate change mitigation costs by 80%. A meat-free diet would reduce them by 70%. Their assessment was based on a target CO2 concentration of 450 ppm. The issue is even more critical when aiming for 350 ppm.

MLA Claim #2

“Trees and plants [that grow where cattle graze] not only provide a home, shade and food for animals, birds and insects, they also help to stop soil erosion.”

The reality

Given the reality of broad-scale land clearing for cattle grazing, it seems bizarre that MLA should try to promote its industry as beneficial in terms of “trees and plants” and soil health. Let’s consider the reality of land degradation (including erosion) and loss of habitat and biodiversity.

The Food and Agriculture Organization of the United Nations (FAO) has stated that livestock production “is one of the major causes of the world’s most pressing environmental problems, including global warming, land degradation, air and water pollution, and loss of biodiversity.” [12]

The plight of the Great Barrier Reef provides a stark example of cattle grazing’s destructive qualities arising from soil erosion.

The journal Water Science and Technology has reported on the impact of run-off from areas used for cattle grazing to the Great Barrier Reef Marine Park (GBRMP) [13]:

“Grazing of cattle for beef production is the largest single land use on the catchment with cropping, mainly of sugarcane, and  urban/residential development considerably less in areal extent. Beef cattle numbers are approximately 4,500,000, with the highest stock numbers in the Fitzroy catchment.”

“Beef grazing on the large, dry catchments adjacent to the GBRMP (in particular the Burdekin and Fitzroy catchments) has involved extensive tree clearance and over-grazing during drought conditions. As a result, widespread soil erosion and the export of the eroded material into the GBR has occurred, and is continuing.”

The 2012-13 report card of the Reef Water Quality Protection Plan (released in 2014) indicated that only 30 percent of graziers had adopted improved land management practices since the plan commenced in 2009. [14]

The 2013 Scientific Consensus Statement also highlighted the livestock sector’s major role in destruction from pollution, primarily in relation to suspended solids (sediment), nitrogen and phosphorus. [15]

The statement confirmed that grazing areas in the catchment were responsible for the following pollutant loads to the Great Barrier Reef lagoon [Footnote 2]:

  • 75 percent of suspended solids
  • 54 percent of phosphorus
  • 40 percent of nitrogen

The release of nitrogen and phosphorus, and the associated nutrient enrichment, contributes significantly to outbreaks of Crown of Thorns starfish, which have had a massive impact on the reef. [16]

I’ve commented further on livestock-related erosion below under the heading “MLA Claim #4 (Carbon sequestration)”.

Water

MLA Claim #3

“The amount of water consumed by an animal to produce 1kg of beef is between 100–400 litres depending on environmental conditions and the productivity of the farm. If you calculate all the rain that falls in an area where cattle are raised then the figure rises to around 50,000 litres. But that rain will still fall whether there are cattle there or not, so to say it takes that much to produce a kg of beef is not really correct.”

The reality

The figure of 50,000 litres per kilogram of beef has been cited many times. However, the estimate was actually 50,000 – 100,000 litres. The source was Wayne Meyer of the Commonwealth Scientific and Industrial Research Organisation (CSIRO) and Professor of Natural Resource Science at The University of Adelaide. [17]

The figures were originally derived for intensive production using irrigated pastures. Prof. Meyer has subsequently suggested that if the same exercise were conducted on rain fed, extensive meat production, there may even be more water involved. The reason is that feed conversion is likely to be lower, energy expended in gathering dry matter (including grass) would be greater and soil evaporation losses may even be higher than in a system involving irrigated pasture. [18]

It then becomes a question of the optimum use of the water, taking into account potential alternative uses. Prof. Meyer has pointed out that water used for irrigation has many alternative uses, including keeping it in the river systems, keeping riverine and wetland ecosystems healthy and providing water to urban and industrial uses. He has noted that alternatives for rain fed areas are more restricted, but could include provision of run-off in catchment areas, growing native vegetation for conservation purposes and or for groundwater recharge.

He has said:

“Using this logic there is little value in arguing that meat production does not embody a lot of water. More  rationally the discussion can be about the value we place on the genuine alternatives for the use of this water.”

In areas where crops for human consumption can be grown, there are high opportunity costs in meat production, with the nutritional output of plant-based foods generally being many times that of meat for any given quantity of water.

Some comparative water usage figures from Prof. Meyer (litres per kilogram of product):

  • Wool: 171,500
  • Beef: 50,000 – 100,000
  • Cotton (lint): 5,300
  • Rice (white): 2,385
  • Wheat: 1,010
  • Maize: 576

If we were to adequately value natural ecosystems, then allowing rain-fed, natural vegetation to be consumed by introduced cattle would carry an extremely high price.

In 2012, the UN adopted a new international standard to give natural capital equal status to GDP. The new approach was referred to in a Scientific American article of 30th August, 2013 headed, Banks Put a Price on Earth’s Life Support“.  [19] The Natural Capital Declaration defined natural capital as “the Earth’s natural assets (soil, air, water, flora and fauna), and the ecosystem services resulting from them, which make human life possible.”

According to the article, the ultimate target date is 2020 “to get an international system up and running and recognized by all governments signed on to the UN Framework Climate Change Convention”.

The article concluded with the words:

“It may be slow and difficult work, they acknowledge, but they believe this is vital to prevent the current economic system destroying the planet.

Profound words indeed.

Greenhouse gas

MLA Claim #4 (Carbon sequestration)

“Unlike many other countries, in Australia our cattle generally graze on extensive, natural pastures which help to capture carbon dioxide, another greenhouse gas. The capture of carbon by plants and storing in the soil is known as ‘sequestration’.”

The reality:

According to Australia’s Chief Scientist:

Based on data from typical perennial grasslands and mature forests in Australia, forests are typically more than 10 times as effective as grasslands at storing carbon on a hectare per hectare basis.” [20]

By definition, natural grasslands would exist in the absence of cows who are members of an introduced species, force-bred in massive, unnatural numbers by the farming sector. In any event, those grasslands are severely compromised by grazing pressures.

Gerard Wedderburn-Bisshop highlighted the impact in a 2012 radio interview. [21] He referred to the “fence line effect” in northern Australia (where around 70 percent of Australia’s beef is produced), whereby bare ground often exists on one side of a fence, while on the other there is knee-high native grass. The bare side is typically owned by a pastoral company seeking to maximise its financial return. It will have increased stocking rates during times of favourable rainfall, then taken too long to reduce those rates during drought. The land becomes degraded, and carbon stores significantly depleted.

The problem was also highlighted in the Land Use Plan (of which Wedderburn-Bisshop was a co-author) produced by climate change advocacy group, Beyond Zero Emissions (BZE) and the Melbourne Sustainable Society Institute of The University of Melbourne. [22] BZE pointed out that soil carbon losses from Australia’s agricultural land due to wind and water erosion are greatly accelerated by the removal and disturbance of vegetation. They said that 80 percent of such emissions came from rangeland grazing areas.

MLA Claim #5 (Ruminant animals)

“There are many animals that are ruminants, they include: cattle, camels, giraffes, bison, deer, sheep, alpacas, yaks, wilderbeests [sic], goats, llamas, buffalo, water buffalo, antelope.”

The reality

I thank MLA for that information.

However, cattle dominate global ruminant biomass (or overall weight), contributing to the fact that not all ruminant species are created equal in terms of environmental destruction. [23]

The forced and selective breeding of food production animals for increased population size and accelerated growth has greatly increased the overall animal biomass and related greenhouse gas emissions.

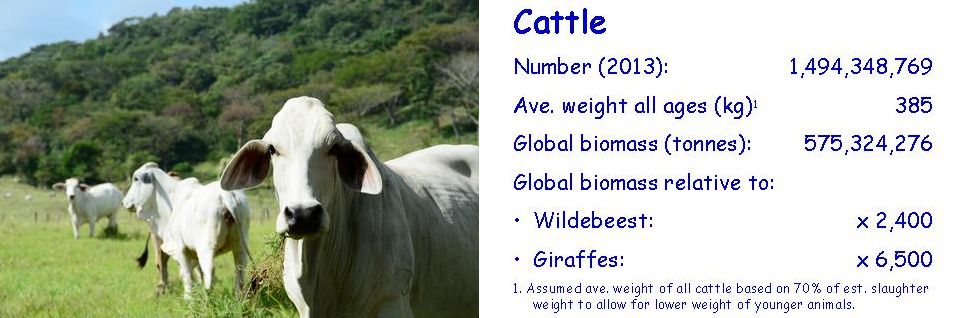
Let’s look at the global biomass of three species used in MLA’s comparison; cattle, giraffes and wildebeest [Footnote 3].

Figure 3: Global biomass of cattle relative to wildebeest and giraffe

Biomass-comparison-cow-2-cropped

Biomass-comparison-wildebeest-cropped Biomass-comparison-giraffe-cropped

Cattle-biomass-relative-to-wildebeest-giraffe-2

Giraffe numbers have plummeted forty percent in the past fifteen years, with only 80,000 remaining in the wild. The global cattle population is nearly 19,000 times the size of the giraffe population. However, because of the giraffe’s larger individual size, the cattle population’s biomass is “only” around 6,500 times the size of the giraffe’s.

At 2,400 times, the comparison with wildebeest is not as significant, but extremely significant nonetheless.

Based on my calculations, cattle represent more than 70 percent of global ruminant biomass. Sheep, goats and buffaloes represent less than 20 percent combined, while the greatly maligned wild camels in Australia represent less than 0.1 percent (or less than one 700th the cattle biomass).

Another key point is that rainforests and other natural environs are not cleared in order to create pasture and crops to feed giraffes or wildebeest. That issue has been referred to earlier in relation to cattle.

MLA Claim #6 (Cattle in the carbon cycle)

“Cattle are a natural part of the carbon cycle. They eat grass containing carbon, they release some of this carbon into the atmosphere, and the carbon in the atmosphere is then re-absorbed by grass as it re-grows.”

The reality

It sounds wonderful, doesn’t it? If only it were true.

The problem is that much of the carbon emitted by ruminant animals is in the form of methane, whereas carbon dioxide is the greenhouse gas absorbed by plants through photosynthesis.

Perhaps MLA could provide the students with an image of a methane molecule (CH4), containing one carbon atom and four hydrogen atoms.

Although methane contains carbon, it is not carbon.

Figure 4: Methane molecule

?????????????????????????????????????????????????????????????????????

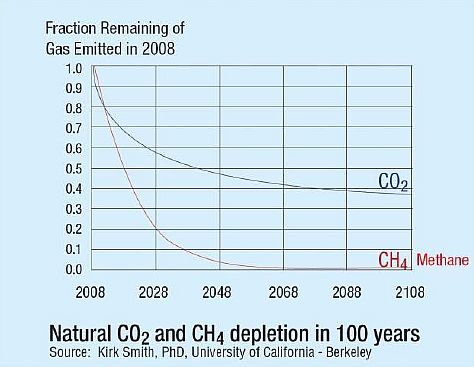
According to the UN’s Intergovernmental Panel on Climate Change (IPCC), over a twenty year time horizon, methane is 86 times as potent a greenhouse gas as carbon dioxide after allowing for climate-carbon feedbacks. Even without those feedbacks, it is 84 times as potent. [24] According to NASA, it is 105 times as potent after accounting for the effects of atmospheric aerosols (particulates). [25]

In the words of Kirk Smith, Nobel laureate and Professor of Global Environmental Health at the University of California, Berkeley, methane is truly carbon on steroids“. [Footnote 4] [26]

MLA Claim #7 (Atmospheric methane concentrations)

“Although carbon dioxide levels in the atmosphere are rising, methane concentrations are stable.”

The reality

Once again, if only it were true. This is what’s happened to methane emissions according to the US National Oceanic and Atmospheric Administration: [27]

Figure 5: Atmospheric Methane Concentrations (NOAA ESRL)

aggi.fig2-methane

Conclusion

It’s bad enough that the PR machines of industry groups such as MLA seek to manipulate the thoughts and actions of adults. However, trying to do the same to children via publications masquerading as legitimate educational tools is unconscionable.

The practice of Western Australia’s Department of Agriculture and Food of linking to MLA’s website on its “upper secondary education resources” page is also questionable. [28]

As unfortunate as it may seem, the ability to remain alert to misinformation from government and industry sources, along with their allies in the media and elsewhere, is a critical skill in our modern society.

Author

Paul Mahony (also on Twitter, Scribd, Slideshare and Viva la Vegan)

Footnotes

1. Gerard Wedderburn-Bisshop is a former principal scientist with the Queensland Government Department of Environment and Resources Management Remote Sensing Centre. He is currently a director and lead scientist with the World Preservation Foundation and was a researcher on Beyond Zero Emission’s Land Use Plan as part of its ZCA2020 project.

2. Comments on nutrient loads were expanded on in the article “Beef and the reef: An update” of 23 December 2018.

3. Because of their longer lifespan (as they are not routinely slaughtered at a young age to the same extent as “traditional” livestock animals), I have used the adult weight of the giraffe and the wildebeest in the comparison. I have only used seventy percent of a cow’s slaughter weight, as the younger animals represent a larger proportion of the population than in the case of the giraffe and the wildebeest. On the same basis, I have used 85% of goats’ and lambs’ slaughter weight, as they are generally slaughtered at a younger age than cattle. I have assumed the number of giraffes in captivity is low relative to the number in the wild.

4. More background on methane’s impact can be seen on my page “GWP Explained“.

Update

17th May, 2015: Reference to Meat and Livestock Australia as a peak industry body deleted.

Sources

[1] Meat & Livestock Australia, “Cattle and the Environment”, June, 2010 (accessed April, 2015), http://www.target100.com.au/Hungry-for-Info/Education/National-Curriculum-Study-Guides [Note: The link is no longer active but updated material as at 27 April 2019 can be accessed here: https://www.goodmeat.com.au/education-resources/]

[2] Derived from Russell, G. “The global food system and climate change – Part 1”, 9 Oct 2008, http://bravenewclimate.com/2008/10/09/the-global-food-system-and-climate-change-part-i/, which utilised: Dept. of Sustainability, Environment, Water, Population and Communities, State of the Environment Report 2006, Indicator: LD-01 The proportion and area of native vegetation and changes over time, March 2009; and ABS, 4613.0 “Australia’s Environment: Issues and Trends”, Jan 2010; and ABS 1301.0 Australian Year Book 2008, since updated for 2009-10, 16.13 Area of crops. Also, in terms of overall land clearing, reference [3], p.232.

[3] Lindenmayer, D. and Burgman, M., “Practical Conservation Biology” (2005, CSIRO Publishing), p. 230, http://www.publish.csiro.au/onborrowedtime/docs/PCB_Ch09.pdf

[4] Map – National Biodiversity Strategy Review Task Group, “Australia’s Biodiversity Conservation Strategy 2010–2020”, Figure A10.1, p. 91, http://www.environment.gov.au/system/files/pages/50e1085f-1ef9-4b25-8275-08808133c346/files/biodiversity-conservation-strategy2010-2020.pdf. Other information derived from Russell, G. “The global food system and climate change – Part 1”, 9 Oct 2008, (http://bravenewclimate.com/2008/10/09/the-global-food-system-and-climate-change-part-i/),which utilised: Dept. of Sustainability, Environment, Water, Population and Communities, State of the Environment Report 2006, Indicator: LD-01 The proportion and area of native vegetation and changes over time, March 2009; and ABS, 4613.0 “Australia’s Environment: Issues and Trends”, Jan 2010; and ABS 1301.0 Australian Year Book 2008, since updated for 2009-10, 16.13 Area of crops.

[5] Roberts, G, “Campbell Newman’s LNP bulldozing pre-election promise”, The Australian, 1 June, 2013, http://www.theaustralian.com.au/national-affairs/campbell-newmans-lnp-bulldozing-pre-election-promise/story-fn59niix-1226654740183; http://sunshinecoastbirds.blogspot.com.au/2013/06/campbell-newman-takes-axe-to-queensland.html

[6] Queensland Department of Science, Information Technology, Innovation and the Arts. 2014. Land cover change in Queensland 2011–12: a Statewide Landcover and Trees Study (SLATS) report. DSITIA, Brisbane, Table 4, p. 28, https://www.qld.gov.au/environment/land/vegetation/mapping/slats-reports/

[7] Derived from Lindenmayer, D. and Burgman, M., op. cit.

[8] Woinarski, J., Traill, B., Booth, C., “The Modern Outback: Nature, people, and the future of remote Australia”, The Pew Charitable Trusts, October 2014, http://www.pewtrusts.org/en/research-and-analysis/reports/2014/10/the-modern-outback

[9] Barson, M., Mewett, J. and Paplinska, J. 2011 Land management practice trends in Australia’s grazing (beef cattle/sheep) industries. Caring for our Country Sustainable Practices fact sheet 2, Department of Agriculture, Fisheries and Forestry, Figure 1, p. 3, http://www.daff.gov.au/__data/assets/pdf_file/0009/2148714/national-factsheet-farm-practicesgrazing.pdf

[10] Hansen, J; Sato, M; Kharecha, P; Beerling, D; Berner, R; Masson-Delmotte, V; Pagani, M; Raymo, M; Royer, D.L.; and Zachos, J.C. “Target Atmospheric CO2: Where Should Humanity Aim?”, 2008. http://www.columbia.edu/~jeh1/2008/TargetCO2_20080407.pdf

[11] Stehfest, E, Bouwman, L, van Vuuren, DP, den Elzen, MGJ, Eickhout, B and Kabat, P, Climate benefits of changing diet Climatic Change, Volume 95, Numbers 1-2 (2009), 83-102, DOI: 10.1007/s10584-008-9534-6 (Also http://www.springerlink.com/content/053gx71816jq2648/)

[12] The Food and Agriculture Organization of the United Nations, “Livestock impacts on the environment”, Spotlight 2006, November 2006, http://www.fao.org/ag/magazine/0612sp1.htm

[13] J. Brodie, C. Christie, M. Devlin, D. Haynes, S. Morris, M. Ramsay, J. Waterhouse and H. Yorkston, “Catchment management and the Great Barrier Reef”, pp. 203 & 205, Water Science and Technology Vol 43 No 9 pp 203–211 © IWA Publishing 200, http://www-public.jcu.edu.au/public/groups/everyone/documents/journal_article/jcudev_015629.pdf

[14] Reef Water Quality Protection Plan, “Report Card 2012 and 2013″, June 2014, http://www.reefplan.qld.gov.au/measuring-success/report-cards/2012-2013-report-card.aspx

[15] Kroon, F., Turner, R., Smith, R., Warne, M., Hunter, H., Bartley, R., Wilkinson, S., Lewis, S., Waters, D., Caroll, C., 2013 “Scientific Consensus Statement: Sources of sediment, nutrients, pesticides and other pollutants in the Great Barrier Reef Catchment”, Ch. 4, p. 12, The State of Queensland, Reef Water Quality Protection Plan Secretariat, July, 2013, http://www.reefplan.qld.gov.au/about/scientific-consensus-statement/sources-of-pollutants.aspx

[16] Brodie, J., “Great Barrier Reef dying beneath its crown of thorns”, The Conversation, 16th April, 2012, http://theconversation.com/great-barrier-reef-dying-beneath-its-crown-of-thorns-6383

[17] Meyer, W., “Water for Food – The Continuing Debate”, Unpublished paper, CSIRO Land and Water,1997

[18] Meyer, W. “Water and meat producers”, Unpublished paper, Nov 2007 (updated Dec 2007 and Jun 2008)

[19] Brown, P and the Daily Climate, “Banks Put a Price on Earth’s Life Support“, Scientific American, 30 August, 2013, http://www.scientificamerican.com/article.cfm?id=banks-put-a-price-on-earths-life-support

[20] Australia’s Chief Scientist, Australian Government, “Which plants store more carbon in Australia: forests or grasses?”(undated), http://www.chiefscientist.gov.au/2009/12/which-plants-store-more-carbon-in-australia-forests-or-grasses/

[21] 3CR Freedom of Species “Gerard Wedderburn-BisshopThe environmental impacts of livestock farming”, 7th October, 2012, http://www.freedomofspecies.org/show/gerard-wedderburn-bisshop-environmental-impacts-livestock-farming

[22] Beyond Zero Emissions and Melbourne Sustainable Society Institute of The University of Melbourne, “Zero Carbon Australia – Land Use: Agriculture and Forestry – Discussion Paper”, October, 2014, p. 47-48, http://bze.org.au/landuse

[23] Various: Food & Agriculture Organization of the United Nations, FAOSTAT, Live animals, 2013, http://faostat.fao.org/site/573/DesktopDefault.aspx?PageID=573#ancor; Poole, R.M., “For Wildebeests, Danger Ahead”, Smithsonian Magazine, May, 2010, http://www.smithsonianmag.com/science-nature/for-wildebeests-danger-ahead-13930092/?no-ist; Estes, R., “Gnu, mammal”, 9-10-2014, Encyclopaedia Britannica, http://www.britannica.com/EBchecked/topic/236391/gnu; Sedghi, S., “Giraffe population decline has conservation groups ringing alarm bells”, ABC News, 5th December, 2014 (updated), http://www.abc.net.au/news/2014-12-04/alarm-raised-over-plummeting-giraffe-numbers/5940204; Schaul, J.C., “Safeguarding Giraffe Populations From Extinction in East Africa”, National Geographic, 17th June, 2014, http://voices.nationalgeographic.com/2014/06/17/safeguarding-giraffe-populations-from-extinction-in-east-africa/; The IUCN Red List of Threatened Species, 2014.3, Giraffa camelopardalis“, http://www.iucnredlist.org/details/9194/0; National Geographic, “Giraffe”, http://animals.nationalgeographic.com/animals/mammals/giraffe/ (accessed 18th April, 2015); Bradford, A., “Giraffe Facts and Photos”, Live Science, 28th October, 2014, http://www.livescience.com/27336-giraffes.html; USDA Weekly National Lamb Market Summary, 17th April, 2015, http://www.ams.usda.gov/mnreports/lswlamb.pdf; Palk, S., “Australia’s wild camel conundrum”, CNN, 15th October, 2010, http://edition.cnn.com/2010/WORLD/asiapcf/10/15/australia.feral.camels/; Bell, S., “Australia, home to the world’s largest camel herd”, 19th May, 2013, http://www.bbc.com/news/magazine-22522695

[24] Myhre, G., D. Shindell, F.-M. Bréon, W. Collins, J. Fuglestvedt, J. Huang, D. Koch, J.-F. Lamarque, D. Lee, B. Mendoza, T. Nakajima, A. Robock, G. Stephens, T. Takemura and H. Zhang, 2013: “Anthropogenic and Natural Radiative Forcing. In: Climate Change 2013: The Physical Science Basis. Contribution of Working Group 1 to the Fifth Assessment Report of the Intergovernmental Panel on Climate Change” , Table 8.7, p. 714 [Stocker, T.F., D. Qin, G.-K. Plattner, M. Tignor, S.K. Allen, J. Boschung, A. Nauels, Y. Xia, V. Bex and P.M. Midgley (eds.)]. Cambridge University Press, Cambridge, United Kingdom and New York, NY, USA, http://www.ipcc.ch/report/ar5/wg1/

[25] Shindell, D.T.; Faluvegi, G.; Koch, D.M.; Schmidt, G.A.; Unger, N.; Bauer, S.E. “Improved Attribution of Climate Forcing to Emissions”, Science, 30 October 2009; Vol. 326 no. 5953 pp. 716-718; DOI: 10.1126/science.1174760,  http://www.sciencemag.org/content/326/5953/716.figures-only

[26] Smith, K.R., “Carbon dioxide is not the only greenhouse gas”, ABC Environment, 25th January, 2010, http://www.abc.net.au/environment/articles/2010/01/25/2778345.htm; Smith, K.R., “Carbon on Steroids:The Untold Story of Methane, Climate, and Health”, Slide 67, 2007, http://www.arb.ca.gov/research/seminars/smith/smith.pdf

[27] NOAA Earth System Research Laboratory, “The NOAA Annual Greenhouse Gas Index (AGGI)”, Summer 2014, http://www.esrl.noaa.gov/gmd/aggi/aggi.html

[28] Government of Western Australia, Department of Agriculture and Food, “Upper secondary education resources”, https://www.agric.wa.gov.au/biosecurity-quarantine/upper-secondary-education-resources?page=0%2C1 (accessed 18th April, 2015)

Images

Young cattle and cow in farm © Sararoom | Dreamstime.com

Eating giraffe  © Pytyczech | Dreamstime.com Blue wildebeest © Davebrotherton | Dreamstime.com

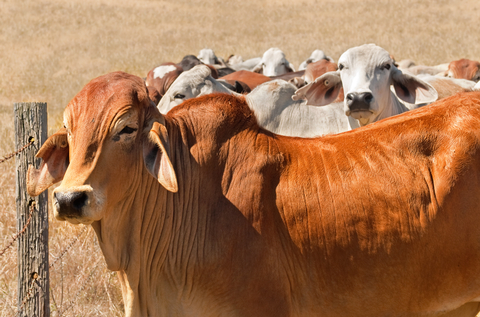
Brahman Cow © Gualberto Becerra | Dreamstime.com

Methane molecule © Barbora Bartova | Dreamstime.com

P1060617

So, it took an anonymous whistleblower to tell the world that 500 pigs died two weeks earlier from heat stress when an air cooling system failed at Grong Grong Piggery in New South Wales, Australia. [1]

The CEO of the company that owns the piggery subsequently said:

The welfare of our animals is our highest priority at all times

Sure, sure, higher than earning profits.

He also said:

Losses like this cut deep emotionally for all staff.

But only after he had said:

These animals are their livelihoods and they care for them every day.

So, they care for them every day because they are their livelihood?

Besides, how well do they really care for them?

Here’s what animal rights group Aussie Farms has reported in respect of this piggery [2]:

The piggery features the largest sow stall shed we’ve ever received footage from, with 8 rows of tiny metal cages stretching far into the distance, confining hundreds and hundreds of pregnant sows for up to 16 weeks at a time.

Several piglets were found in pieces – some in the farrowing crates, some in the aisles of the farrowing crates, and some outside. One piglet had been ripped in half with his legs nearby. Another piglet’s head was found in the aisle near his legs. The back half of a piglet was found in a farrowing crate. Several buckets of dead piglets were found inside and outside the farrowing sheds. It is unclear what is causing the pigs to be severed into pieces and scattered throughout the facility – most likely a combination of cannibalism and worker mistreatment.

Trolleys full of rotting piglet tails were found in the farrowing crate sheds.

Many sows were found with pressure sores and other injuries.

Of course, the producer-owned organisation that administers the quality audit program (including animal welfare), Australian Pork Ltd, defended the producer in respect of Aussie Farms’ revelations. [3]

What hope do the pigs have?

Author

Paul Mahony (also on Twitter, Scribd, Slideshare and Viva la Vegan)

References

[1] Pearson, A. and Jacobs, S., “500 pigs die from heat stress at NSW piggery”, Sydney Morning Herald, 13th March, 2015, http://www.smh.com.au/environment/animals/500-pigs-die-from-heat-stress-at-nsw-piggery-20150313-143j4l.html

[2] Aussie Farms, “Grong Grong Piggery”, May 2014, http://www.aussiepigs.com/piggeries/grong-grong

[3] Pearson, A. and Jacobs, S., op cit.

Image

Aussie Farms

Note

This article first appeared on the website of Melbourne Pig Save on 14th March, 2015.

?????????????????????????????????????????????????????????????????????????????????????????????????????????????????????????

Setting the scene

If you’ve been following my blog, you’ll know that I consider climate change to be a massive threat to life on Earth. I’ve said before that it’s difficult to overstate the seriousness of our current predicament. The following letter recently published in The Age newspaper summarises some key aspects of my position:[1]

“Adam Morton reports that only a modest deal, to be ‘built on over time’, is anticipated at the Paris climate summit. Unfortunately, the planet cannot wait. Part of the problem is the fact that negotiations are based on projections developed by the IPCC, an organisation described by Professor Tim Flannery as ‘painfully conservative’. Dire as they are, those projections do not allow for many critical climate feedback mechanisms that create a very real risk of runaway climate change. The climate crisis requires emergency action. During World War II, the governments of the US, UK, Germany, Japan and Australia were committing around 40-70 per cent of GDP to the war effort. Trillions of dollars were utilised in dealing with the global financial crisis. Where is the required monetary commitment to the greatest threat ever faced by the inhabitants of our magnificent planet? Feigned concern, platitudes and paper-thin treaties will achieve nothing.”

A major development at the Guardian

As you might imagine, I was delighted to find that the Guardian’s outgoing editor, Alan Rusbridger, had decided to feature the climate crisis “front and centre” in the lead up to his departure in the middle of the year. [2]

If you’re not familiar with the Guardian, it launched as the Manchester Guardian on 5 May 1821. Its website indicates it now has more than forty million readers worldwide, and is the third most-read English-language newspaper website in the world.

I posted the following comment beneath Rusbridger’s article, in which he had highlighted the key role that environmental campaigners and writers Bill McKibben and Naomi Klein would play in forthcoming articles:

“This is exactly where it needs to be – front and centre! Thanks for putting it there. However, you are far too conservative in accepting the notion of a carbon budget and implying that anything up to a 2C increase in temp would be acceptable. If we want a 10 percent chance of avoiding 2C, then there is effectively no carbon budget available. It’s also essential that you highlight animal agriculture’s massive impact and openly discuss the potential for nuclear power, a potent, carbon-free energy source, the dangers of which appear to be significantly overstated. Bill McKibben and his fellow 350.org board member, Naomi Klein, are certainly not the ideal people to be relying on for direction in relation to those two issues. Please see more at terrastendo.”

The comment replaced an identical one I had posted a few minutes earlier, with the exception that I had inadvertently duplicated some material in the first post. As a result, I used the “report” option and utilised the “other” category, meaning I was not reporting anything relating to “personal abuse”, “off topic”, “legal issue”, “trolling”, “hate speech”, “offensive/threatening language”, “copyright”, or “spam”. I explained that some material had been duplicated, and requested that the original post be deleted, as I did not appear to have the option of deleting it myself.

What happened next

When I checked a short time later, both my original post and the one that replaced it had been deleted. Fortunately, I had copied it, and was able to post it again as a new comment. However, the new post was also deleted soon after. This happened several times. On some occasions I introduced it with a sentence explaining that it was replacing an earlier comment that had been deleted, and asking the moderator to explain why.

As the comment did not re-appear, I sent the following emails to the moderator at cif.moderation@theguardian.com:

Email 1:

“I am insulted that the moderator has continually removed my comments in response to the above article without explanation. I feel that my comments were extremely relevant and reasonable.”

Email 2:

“Am I being deleted automatically after ‘reporting’ one of my own posts which contained a duplication, and requesting that you delete it? I had replaced it with a corrected version. If this is not an error on the Guardian’s part, then I am very concerned about your editorial stance.” 

At the time of writing this article, fourteen hours after the second email, no one at the Guardian has responded.

My comments appear to have easily complied with the Guardian’s community standards and participation guidelines. In one post, I deleted reference to my website, even though it was very relevant to the discussion and therefore seemed to be in order. In any event, that comment was also deleted.

I have a policy of always “playing with a straight bat” (a cricketing term) when online and elsewhere. I base my arguments on the facts as I see them, and refuse to be dragged into condescending or abusive discussions.

Ramifications

Apart from the insult of being censored and ignored, I am concerned that comments, which I believe to be relevant and important in the context of such a critical issue, are not available for those at the Guardian, and others, to consider (and object to if they wish).

I am wondering if organisations that challenge the traditional “establishment” (and the left-leaning Guardian has challenged much over the years) tend to eventually become part of it themselves, and unwilling to consider views that differ much from their own. But then again, I doubt that one of the Guardian’s celebrity columnists, George Monbiot, would have objected to my comments or my right to present them. (At least, that’s at the present time; Monbiot has changed his position occasionally on some major issues.)

I’ll scratch my head a little longer, and continue to seek a response from a publication that I once had a reasonable amount of respect for.

Update

After contacting various people at the Guardian, my comment was reinstated on 9th March, 2015.

Out of courtesy to the Guardian, I will not post their explanatory email here. However, I believe my response satisfactorily alludes to the points they made, most of which I did not consider to be valid.

MY RESPONSE TO THE GUARDIAN:

I am very surprised that you considered my original post to be “spam-like”, simply because I included a link to my website. As I have said elsewhere:

“My comments appear to have easily complied with the Guardian’s community standards and participation guidelines. In one post, I deleted reference to my website, even though it was very relevant to the discussion and therefore seemed to be in order. In any event, that comment was also deleted.”

Your community standards say (with reference to commercial entities and other organisations deleted because you’ve already noted that you understand my site is a personal blog):

“we actively discourage people . . . who frequently post propaganda or external links without adding substantively to the quality of the discussion on the Guardian website.”

So I was frequently posting external links without adding substantively to the quality of the discussion?

My first comment in relation to the article was deleted. Where’s the frequency prior to that? There was none.

Even if there had been, a quick check of my site would have shown that it was relevant to the discussion. The sub-title starts with the words “for animals and the planet”. Two of the four issues covered by the site (as shown on the home page) relate to climate change (and represent more than half the content).

You may say there was no time to check my site. However, I would like to think I was owed that courtesy, rather than being removed without explanation, particularly after submitting what I would like to think was a well-considered comment that added some value to the discussion.

You have said, “While occasional linking to a personal blog is fine in the context of the conversation, you had included a link with something along the lines of ‘read more here’ in almost every post you have made”.

The link was removed on my third attempt. I only kept it in after that because it didn’t seem to be the problem; the post that excluded it was (as you have acknowledged) also deleted. Apart from that aspect and the fact that I was asking why my posts were being deleted, the content of each post was identical.

I believe your words “in almost every post you made” would give most people the impression that I was submitting a series of posts with different content. That was not the case; I was simply trying to have what I consider to be a very reasonable comment published.

You have said you are a small team dealing with many users. Your organisation’s core function is communication. You should maintain a team of moderators that is large enough to enable them to engage with readers in a more considered fashion than occurred on this occasion.

END OF MY RESPONSE

Author

Paul Mahony (also on Twitter, Scribd, Slideshare and Viva la Vegan)

References

[1] Mahony, P., The Age letters to the editor, 10th January, 2015,
http://www.theage.com.au/comment/the-age-letters/time-is-running-out-we-need-to-make-a-choice-20150110-12lp1p.html

[2] Rusbridger, A., “Climate change: why the Guardian is putting threat to Earth front and centre”, The Guardian, 6th March, 2015, http://www.theguardian.com/environment/2015/mar/06/climate-change-guardian-threat-to-earth-alan-rusbridger

Image

The Guardian © GilbertC | Dreamstime.com

Cowspiracy

I’ve written about the Australian red meat industry’s response to the documentary film Cowspiracy in two previous posts. This post consolidates the key points and provides some new perspectives.

Who’s representing the industry?

The industry’s arguments appear on its Target 100 website, which has been established by five organisations: Meat & Livestock Australia; Australian Lot Feeders Association; Australian Meat Industry Council; Sheep Meat Council of Australia; and Cattle Council of Australia. [1]

Based on that level of representation, it seems that the industry is keen to defend itself against the movie’s claims.

Seventeen arguments become twelve

In its website posts of October and November, 2014, the industry put forward seventeen arguments to support its position. Some of those arguments, relating to research activities and methane, were effectively repeated many times. By my reckoning, the result is that only twelve distinct arguments were presented. I’ll consider them all in this post, with some repetition from my previous posts. [Footnote 1].

The industry has shot itself in the foot

With four of the twelve arguments, the industry has figuratively shot itself in the foot.

Shot in the foot #1: Dr Barry Traill

At the time of writing, the industry is claiming on its website that the director of The Pew Charitable TrustsOutback Australia program, Dr Barry Traill (mis-spelt “Trail” on the website), argues that using arid land for cattle grazing may be positive in Australia. The evidence they cite is Dr Traill’s TEDx presentation of May, 2014, Populate wilderness or perish“.

A key point of the presentation was that we need more people in the Outback than at present, in order to appropriately manage issues such as fire regimes and feral animals. [Footnote 2]

Dr Traill’s comment on the cattle industry occupied just 5 seconds of that 10 minute 48 second presentation. He said (at 9:05), “Many cattle station owners are doing a great job of managing their part of the outback”.

But do the words “doing a great job” mean livestock grazing? He may have meant that many pastoralists are reducing livestock numbers and diversifying into other activities with clear environmental benefits.

Dr Traill co-authored Pew’s October, 2014 publication, The Modern Outback: Nature, people, and the future of remote Australia“. [2] The authors have commented extensively on the destructive environmental impacts of grazing. Problems include tree clearing, introduction of invasive pasture grasses, degradation of land and natural water sources, and manipulation of fire regimes (p. 167-171).

The authors highlighted the fact that the environment improves when pastoralists move away from intense grazing activity.  In one example, the pastoralists “are closely monitoring the gradual regrowth of grazing-sensitive plants.” They “host Outback farm stays and tours to diversify their income and raise awareness about the importance of giving pastoral land time to recover from over a century of intense grazing.” (p. 170)

In his TEDx presentation and elsewhere, Dr Traill has emphasised the fact that the number of Aboriginals in remote Outback areas has reduced as people have moved into more central settlements and towns. As a result of this trend, some native animal species have either disappeared or greatly declined. [3]

In the report mentioned above, he and his co-authors highlight the need for people to help manage the environment, but their position should not be interpreted as one that promotes the idea of more pastoralists grazing livestock. The report highlights that extensive benefits have been derived through the introduction of indigenous ranger groups and the declaration of indigenous protected areas (IPAs) across huge regions. There are now 67 IPAs covering more than 540,000 square kilometres, which is more than twice the size of the state of Victoria. There are also more than 750 indigenous rangers managing and safeguarding the land.

Pastoral leases for cattle, sheep and goats cover around 40 percent of the Outback, which in turn occupies 73 percent of the 7.7 million square kilometre continent. Between 60 and 70 percent of the continent as a whole is managed through such leases. The Pew Charitable Trust is campaigning for state governments to permit (unlike at present) non-grazing related activities on pastoral land. An example is Western Australia, where the relevant leases (occupying 30 percent of the state’s massive land area) will expire in June 2015. The organisation “recommends making a diversity of options available for pastoral lease lands and ensuring good governance with a focus on sustainable management, population support and economic viability”. [4]

The organisation certainly does not appear to be supporting grazing activity in terms of environmental performance.

Shot in the foot #2: Biodiversity and other environmental impacts

The industry says that greenhouse gas emissions are just one aspect of environmental management. It says that while there is enormous focus on how to reduce methane emissions “this needs to be done with consideration for impacts on other important environmental factors such as  biodiversity”.

I couldn’t agree more!

The Food and Agriculture Organization of the United Nations (FAO) has stated that livestock production “is one of the major causes of the world’s most pressing environmental problems, including global warming, land degradation, air and water pollution, and loss of biodiversity.” [26]

Although the industry is supporting research in relation to issues such as water, soil and ground cover, and biodiversity, much of the research can only assist in finding incremental improvements relative to the benefits that could be derived from a general move away from animal agriculture.

Shot in the foot #3: Grass-fed versus grain-fed animals

The industry seems keen to point out that the extent to which cattle are grain-fed in Australia is lower than in the US.

They don’t seem to recognise that while cows are fed on grass, they produce far more methane than when they are fed on grain.

Australia’s Commonwealth Scientific and Industrial Research Organisation (CSIRO) has estimated that cows fed on grass produce 4 times as much methane as those fed on grain. [5]

In November, 2013, the FAO (Food and Agriculture Organization of the United Nations) reported that the global average emissions intensity (kilograms of greenhouse gas emissions per kilogram of end product) was 81 percent higher in beef derived from animals on “grazing” (or “grass-based”) feeding systems than in those on “mixed” systems. [6] (Cows are not fed grain exclusively. They have not evolved to consume it, and if it is used at all, they are generally only “finished” on it for up to 120 days prior to slaughter.)

Even a study by The University of New South Wales, funded by Meat & Livestock Australia and referred to on the Target 100 website, reported that grass-fed cows produce more methane than others. [8]

Perhaps the industry has overlooked the research it has funded, and believes that the natural way is best in all respects, when clearly it is not.

At least they’re not alone. The Australian Conservation Foundation (ACF) and Bill McKibben of 350.org have made similar claims, with neither citing any evidence for their position. [9] However, the ACF has subsequently removed its comments from the relevant websites.

Shot in the foot #4: Reduction of 5.3% in beef’s emissions intensity in 20 years (and they think that’s good)

The industry claims that the Australian production efficiencies have resulted in a 5.3% reduction in emissions per tonne of beef between 1990 and 2010. Why does that represent a shot in the foot? The industry applauds a 5.3% reduction in 20 years, which equals an annual rate of 0.286% from the reducing balance.

At that rate, it would take 243 years to achieve a 50% reduction from the 1990 level.

Here’s how the current global average emissions intensity of grass-fed beef compares with soy beans and legumes [Footnote 3]:

Figure 1: Emissions intensity (kg CO2-e/kg product) with GWP20

Emissions-intensity-sharpened

If we were to halve the figure for grass-fed beef (perhaps generously assuming Australia’s figure was half the global average), and then halve it again looking ahead 243 years, then the figure for grass-fed beef (72 kg/kg CO2-e) would still be around 20 to  35 times greater than that of legumes and soy beans (using a 20-year timeframe for assessing the global warming potential of relevant greenhouse gases).

In any event, we can’t wait 243 years or more to turn this problem around, particularly when a rapid and dramatic improvement in our food system’s environmental performance could be achieved by simply moving away from animal-based products.

Eight remaining arguments are very weak

I have commented on these arguments elsewhere (see article links below), so will only comment briefly here.

Research

The “Target 100” title refers to one hundred industry initiatives, including research, aimed at improving its environmental performance. However, in terms of global warming, the performance of animal-based and plant-based products are on different paradigms. No amount of research is likely to reduce animal-based emissions to a level that is realistically comparable to that of the plant-based alternatives.

Land clearing

The industry states that it does not buy grain from the Amazon, and that the Australian industry’s emissions from deforestation have reduced dramatically since 2006.

However, we have cleared around 700,000 square kilometres of land in this country for animal agriculture, so we don’t need to look towards South America for staggering levels of environmental destruction. [10] Also, the legislation banning broadscale land clearing (subject to exemptions) was overturned by the Queensland Liberal National Party government in 2013 in respect of land deemed to be of “high agricultural value”. [11]

The recently elected Labor government may review that legislation, but the forests will always be at risk of further clearing, depending largely on the inclination of the government of the day. The recent free trade deal with China is likely to increase pressure for further livestock-related land clearing.

In any event, we must live with the legacy of foregone carbon sequestration, which is not accounted for in any official emissions figures.

Alignment with National Greenhouse Gas Inventory figures

The industry points out that the figures it uses are aligned with those of the Australian Government’s National Greenhouse Inventory.

That’s true, but as I have stated elsewhere, critical under-reporting of livestock’s impact occurs in many “official” figures because relevant factors are omitted entirely, classified under non-livestock headings, or considered but with conservative calculations. [12] Do we want to know what’s really happening so that we can identify necessary mitigation opportunities, or do we want it masked in this way?

Life Cycle Assessment Study

The life cycle assessment study cited and funded by the industry did not appear to include land clearing and certain other factors often included in such studies. [8] Even without those factors, the results were very poor, with beef’s emissions intensity figures being multiples of plant-based alternatives.

As an alternative, applying a 20-year GWP for relevant gases to the FAO’s average emissions intensity figure for specialised beef in Oceania (which includes Australia) [7], and adjusting for retail weight, would result in a figure of around 100 kg CO2-e/kg of product. The figure for grass fed beef in isolation would be significantly higher.

Grain grown solely for animals?

The industry claims that cattle are not consuming grains that humans can eat, and are therefore not depriving those who are undernourished of food.

The resources (including land) used to grow grain for cattle have many possible alternative uses, including food production for humans or regeneration of natural habitat, helping to draw down existing atmospheric carbon as a critical climate change mitigation measure. Utilising those resources to provide food for livestock in a grossly and inherently inefficient system is unnecessary, unjust, and incredibly damaging to the environment.

Livestock’s Long Shadow discrepancies

The industry has referred to some recognised discrepancies in the methodologies utilised by the FAO in its 2006 “Livestock’s Long Shadow” report. Regardless of those concerns, the FAO’s latest estimate of livestock’s contribution to global warming (14.5%) is significant, despite being extremely conservative. Regardless of the percentage arrived at, we are unlikely to overcome climate change without a general transition toward plant-based products. [13]

Great Barrier Reef

The industry says it accepts its role in seeking to improve the health of the Great Barrier Reef. Yet the 2012-13 report card of the Reef Water Quality Protection Plan (released in 2014) indicated that only 30 percent of graziers had adopted improved land management practices since the plan commenced in 2009. [14]

The 2013 Scientific Consensus Statement highlighted the livestock sector’s major role in destruction from pollution, primarily in relation to suspended solids (sediment), nitrogen and phosphorus. [15] The release of nitrogen and phosphorus, and the associated nutrient enrichment, contributes significantly to outbreaks of Crown of Thorn starfish, which have had a massive impact on the reef. [16]

World Wildlife Fund

The industry argues that “Cowspiracy” is incorrect in suggesting that no environmental groups are looking into the beef industry due to its political power. It refers to the World Wildlife Fund’s involvement in the Global Roundtable for Sustainable Beef.

I argue that a transformational change of diet is required, rather than a search for “sustainable beef”, which is a term I regard as an oxymoron in the context of our current environmental emergencies, including climate change.

Of interest may be the fact that the World Wildlife Fund (WWF) has been accused of working with major business organisations that allegedly use the WWF brand to help improve their green credentials, while acting against the interests of the environment. [17]

What is methane?

The industry has also created a page headed “What is methane?“, which has (at the time of writing) some serious and not so serious shortcomings. [18]

Firstly, it says that methane is 25 times as potent as carbon dioxide as a greenhouse gas. That figure is out of date. The IPCC (Intergovernmental Panel on Climate Change) used a figure of 25 in 2007 but increased it to 34 (with climate carbon feedbacks) in its 2013 Fifth Assessment Report. [19]

Secondly, the figure is based on a 100-year time horizon. A 20-year time horizon may be more appropriate when considering methane’s emissions due to the relatively rapid breakdown of the gas in the atmosphere.  On that basis, the IPCC reports that methane is 86 times as potent as carbon dioxide (with climate carbon feedbacks).

The IPCC says, “There is no scientific argument for selecting 100 years compared with other choices. The choice of time horizon is a value judgement because it depends on the relative weight assigned to effects at different times.” [20] (NASA estimates the multiple to be 105 when allowing for direct and indirect radiative effects of aerosol responses.) [21]

Thirdly, the page refers to the “International” Panel on Climate Change, when the correct term is “Intergovernmental”, as referred to above.

Finally, the industry indicates that methane levels in the atmosphere have remained stable since 2000 “despite significant increases in livestock numbers globally”.  If only it were true. This is what’s happened to methane emissions according to the US National Oceanic and Atmospheric Administration: [22]

Figure 2: Atmospheric Methane Concentrations (NOAA ESRL)

aggi.fig2-methane

Conclusion

The red meat industry can argue forever about the supposed environmental credentials of its products. However, we face a crisis in the form of climate change and other environmental issues. Those without a vested interest need to face the reality of that crisis, and fight for urgent action.

It is pleasing that the United States Dietary Guidelines Advisory Committee has recently recommended a reduction in meat consumption for environmental and health reasons. [23] That development may add to the general awareness that appears to be developing in respect of climate change, including animal agriculture’s adverse impacts.

Author: 

Paul Mahony (also on Twitter, Scribd, Slideshare and Viva la Vegan)

Footnotes:

1. In assessing the industry’s various arguments, I have categorised two concerning grass-fed cows as methane arguments, due to the fact that grass-feeding is a key factor in that regard.

2. Dr Traill has said that there have been two reasons for the decline in native animal species as Aboriginal people left remote areas. The first is fire. “Drier areas were burnt in particular ways by Aboriginal people. The usual pattern was to have smaller spot fires in different seasons to create a patchwork of vegetation of various ages. This mosaic approach provides the right habitat mix for different animals, particularly some mammals.”  He points out that without people to manage the burning, most outback fires are larger and fiercer than they were previously. For example, in the western desert country of the Martu people, the average area of a single fire has increased from 64 hectares to 52,000 hectares. The second reason is invasive plant and animal species, including feral cats, rabbits, cane toads, water buffalo, goats, camels, pigs, donkeys, horses, cattle and noxious foreign weeds including various types of pasture grasses. He says: “To stay healthy, even our most remote landscapes need regular care and maintenance.”

3. For grass-fed beef, the FAO has reported a global average emissions intensity figure of 102.2 kg CO2-e/kg of product. The reference period is 2005. [24]

That figure was based on carcass weight. If we gross it up to allow for the fact that not all the carcass is used as end product for the dinner table, the figure increases to 140.2. That’s based on the US Department of Agriculture’s mid-range yield estimate of 72.8% for beef. [25]

When we then adjust the figure to allow for a 20-year global warming potential for methane (86 compared to 25) and nitrous oxide (268 compared to 298), it increases to 287. (The figure of 287 is slightly lower than a previous estimate (291) due to the adjustment of nitrous oxide’s GWP.)

The figure of 287 attributes all carcass weight emissions to retail cuts of meat. If emissions are also attributed to other products that may be derived from the carcass, utilising fat, bone and the like, then the emissions intensity of the retail cuts will be lower than shown here, at around 209 kg CO2-e/kg product.

The figures are based on the breakdown by the FAO of the different greenhouse gases contributing to beef’s emissions intensity (CO2 26.9%; CH4 44.0%; N2O 29.1%). As each of those percentages represents the average between grazing and mixed systems, the figures for grass-fed beef may be understated. That’s because methane’s share of emissions in a grazing system would be higher than in a mixed system, and the methane figure is grossed up considerably when adjusting for a 20 year global warming potential. The emissions intensity figures vary significantly by region.

The figures for soy beans and legumes are from a 2014 study by Oxford University researchers (Scarborough, et al.). [26]

Updates:

  • Additional comments added to Footnote 3 regarding the FAO’s reference period and methane’s share of emissions. (22nd Feb, 2015)
  • Figures in item #4 amended to reflect a reduction of 5.3% in emissions intensity over a period of 20 years, rather than 24 years. (Although the industry’s comments were published in 2014, they reflect 2010 production figures.) (22nd Feb, 2015)
  • Comments added in relation to the life cycle assessment study. (25th Feb, 2015)
  • Comments regarding retail cuts of meat added to Footnote 3 on 4th April, 2015.

Author: 

Paul Mahony (also on Twitter, Scribd, Slideshare and Viva la Vegan)

Main Image: From Cowspiracy: the sustainability secret, http://www.cowspiracy.com/. Used with permission.

Related articles:

Cowspiracy and the Australian red meat industry (9th Nov, 2014)

More on Cowspiracy and the Australian red meat industry (6th Dec, 2014)

Livestock and climate: Do percentages matter? (15th Nov, 2014)

References:

[1] Meat & Livestock Australia; Australian Lot Feeders Association; Australian Meat Industry Council; Sheep Meat Council of Australia; and Cattle Council of Australia, “Target 100: Cowspiracy”, 28th October and 24th November, 2014, http://www.target100.com.au/Hungry-for-Info/Target-100-Responds/Cowspiracy (accessed 21st February, 2015)

[2] Woinarski, J., Traill, B., Booth, C., “The Modern Outback: Nature, people, and the future of remote Australia”, The Pew Charitable Trusts, October 2014, http://www.pewtrusts.org/en/research-and-analysis/reports/2014/10/the-modern-outback

[3] Traill, B., “Populate or perish”, The Pew Charitable Trusts Outback Program, Opinion, 12th January, 2015, http://www.pewtrusts.org/en/about/news-room/opinion/2015/01/12/populate-or-perish

[4] “Pastoral lease reform: Opportunity knocks for Western Australia”, The Pew Charitable Trusts News, 27th October, 2014, http://www.pewtrusts.org/en/about/news-room/news/2014/10/27/pastoral-lease-reform-for-western-australia

[5] Harper, L.A., Denmead, O.T., Freney, J.R., and Byers, F.M., Journal of Animal Science, June, 1999, “Direct measurements of methane emissions from grazing and feedlot cattle”, J ANIM SCI, 1999, 77:1392-1401, http://www.ncbi.nlm.nih.gov/pubmed/10375217; http://www.journalofanimalscience.org/content/77/6/1392.full.pdf

[6] Food and Agriculture Organization of the United Nations, “Tackling climate change through livestock: A global assessment of  emissions and mitigation opportunities”, Nov 2013, Table 5, p. 24, http://www.fao.org/ag/againfo/resources/en/publications/tackling_climate_change/index.htm; http://www.fao.org/docrep/018/i3437e/i3437e.pdf

[7] Food and Agriculture Organization of the United Nations, “Greenhouse gas emissions from ruminant supply chains: A global life cycle assessment”, Nov 2013, Fig. 12, p. 30, http://www.fao.org/ag/againfo/resources/en/publications/tackling_climate_change/index.htm; http://www.fao.org/docrep/018/i3461e/i3461e.pdf

[8] Peters, G.M., Rowley, H.V., Wiedemann, S., Tucker, R., Short, M.D., Schultz, M., “Red Meat Production in Australia: Life Cycle Assessment and Comparison with Overseas Studies”, Environ. Sci. Technol., 2010, 44 (4), pp 1327–1332, DOI: 10.1021/es901131e, online January 12, 2010, http://pubs.acs.org/doi/abs/10.1021/es901131e

[9] Mahony, P. “Do the math: There are too many cows!”, Terrastendo, 26th July, 2013, https://terrastendo.net/2013/07/26/do-the-math-there-are-too-many-cows/

[10] Derived from Russell, G. “The global food system and climate change – Part 1”, 9 Oct 2008, http://www.bravenewclimate.com, which utilised: Dept. of Sustainability, Environment, Water, Population and Communities, State of the Environment Report 2006, Indicator: LD-01 The proportion and area of native vegetation and changes over time, March 2009; and ABS, 4613.0 “Australia’s Environment: Issues and Trends”, Jan 2010; and ABS 1301.0 Australian Year Book 2008, since updated for 2009-10, 16.13 Area of crops.

[11] Roberts, G, “Campbell Newman’s LNP bulldozing pre-election promise”, The Australian, 1 June, 2013, http://www.theaustralian.com.au/national-affairs/campbell-newmans-lnp-bulldozing-pre-election-promise/story-fn59niix-1226654740183; http://sunshinecoastbirds.blogspot.com.au/2013/06/campbell-newman-takes-axe-to-queensland.html

[12] Mahony, P., Omissions of Emissions: A Critical Climate Change Issue, Terrastendo, 9th February, 2013, https://terrastendo.net/2013/02/09/omissions-of-emissions-a-critical-climate-change-issue/

[13] Mahony, P. “Livestock and climate change: Do percentages matter?”, Terrastendo, 15th November, 2014, https://terrastendo.net/2014/11/15/livestock-and-climate-do-percentages-matter/

[14] Kroon, F., Turner, R., Smith, R., Warne, M., Hunter, H., Bartley, R., Wilkinson, S., Lewis, S., Waters, D., Caroll, C., 2013 “Scientific Consensus Statement: Sources of sediment, nutrients, pesticides and other pollutants in the Great Barrier Reef Catchment”, Ch. 4, p. 12, The State of Queensland, Reef Water Quality Protection Plan Secretariat, July, 2013, http://www.reefplan.qld.gov.au/about/scientific-consensus-statement/sources-of-pollutants.aspx

[15] Reef Water Quality Protection Plan, “Report Card 2012 and 2013″, June 2014, http://www.reefplan.qld.gov.au/measuring-success/report-cards/2012-2013-report-card.aspx

[16] Brodie, J., “Great Barrier Reef dying beneath its crown of thorns”, The Conversation, 16th April, 2012, http://theconversation.com/great-barrier-reef-dying-beneath-its-crown-of-thorns-6383

[17] Vidal, J., “WWF International accused of ‘selling its soul’ to corporations”, The Guardian, 4th October, 2014, http://www.theguardian.com/environment/2014/oct/04/wwf-international-selling-its-soul-corporations

[18] Meat & Livestock Australia; Australian Lot Feeders Association; Australian Meat Industry Council; Sheep Meat Council of Australia; and Cattle Council of Australia, “Target 100: What is methane?” (accessed 21st February, 2015), http://www.target100.com.au/Environment/Emissions/What-is-methane

[19] Myhre, G., D. Shindell, F.-M. Bréon, W. Collins, J. Fuglestvedt, J. Huang, D. Koch, J.-F. Lamarque, D. Lee, B. Mendoza, T. Nakajima, A. Robock, G. Stephens, T. Takemura and H. Zhang, 2013: “Anthropogenic and Natural Radiative Forcing. In: Climate Change 2013: The Physical Science Basis. Contribution of Working Group 1 to the Fifth Assessment Report of the Intergovernmental Panel on Climate Change” , Table 8.7, p. 714 [Stocker, T.F., D. Qin, G.-K. Plattner, M. Tignor, S.K. Allen, J. Boschung, A. Nauels, Y. Xia, V. Bex and P.M. Midgley (eds.)]. Cambridge University Press, Cambridge, United Kingdom and New York, NY, USA, http://www.ipcc.ch/report/ar5/wg1/

[20] ibid., pp. 711-712.

[21] Shindell, D.T., Faluvegi, G., Koch, D.M., Schmidt, G.A., Unger, N., Bauer, S.E., Improved Attribution of Climate Forcing to Emissions“, Science 30 October 2009: Vol. 326 no. 5953 pp. 716-718 DOI: 10.1126/science.1174760, https://www.sciencemag.org/content/326/5953/716.figures-only

[22] NOAA Earth System Research Laboratory, “The NOAA Annual Greenhouse Gas Index (AGGI)”, Summer 2014, http://www.esrl.noaa.gov/gmd/aggi/aggi.html

[23] Rothkopf, J., “Major dietary guidelines report recommends decreasing meat consumption”, Salon.com, 20th February, 2015, http://www.salon.com/2015/02/19/major_dietary_guidelines_report_recommends_decreasing_meat_consumption/

[24] Food and Agriculture Organization of the United Nations, “Tackling climate change through livestock: A global assessment of emissions and mitigation opportunities”, Nov 2013, extract of Fig. 7, p. 24 (Meat), http://www.fao.org/ag/againfo/resources/en/publications/tackling_climate_change/index.htm

[25] United States Department of Agriculture Economic Research Service, Agricultural Handbook No. 697, June, 1992 (website updated 10 September, 2013), “Weights, Measures, and Conversion
Factors for Agricultural Commodities and Their Products”, Table 11. p. 21,
http://www.ers.usda.gov/publications/ah-agricultural-handbook/ah697.aspx#.U0ihR6Ikykw

[26] Scarborough, P., Appleby, P.N., Mizdrak, A., Briggs, A.D.M., Travis, R.C., Bradbury, K.E., & Key, T.J., “Dietary greenhouse gas emissions of meat-eaters, fish-eaters, vegetarians and vegans in the UK”, Climatic Change, DOI 10.1007/s10584-014-1169-1, http://link.springer.com/article/10.1007%2Fs10584-014-1169-1

???????????????????????????????????????????????????????????????????????????????????????????

Note from author: My article An industry shooting itself in the foot consolidates and expands on material from this article and the article Cowspiracy and the Australian red meat industry. For now, here’s “More on Cowspiracy and the Australian red meat industry”:

In my post Cowspiracy and the Australian red meat industry, I responded to some comments from the industry on the documentary film, Cowspiracy: The Sustainability Secret. The industry has since commented further, and I respond to the latest comments below.

Meat Industry Claim: The industry says it invests in research to understand how it can continue to reduce emissions associated with beef production. It says, “If people would like to understand the research underway please visit our emissions page.”

My response: The first problem with the industry’s claim is that its emissions page indicates that “methane is 21-25 times more potent than carbon dioxide as a thermal warming  gas”. Those figures are out of date.

The IPCC (Intergovernmental Panel on Climate Change) used a figure of 25 in 2007 but increased it to 34 (with carbon cycle feedbacks) in its 2013 Fifth Assessment Report. [1]

Another concern is that the figure is based on a 100-year time horizon. By using that period, traditional reporting methods have understated methane’s shorter-term climate change impacts. It’s the shorter term impacts that are now critical as we try to avoid climate change tipping points with potentially catastrophic and irreversible consequences.

The reason the shorter term impacts are understated when they are based on a 100-year time horizon is that methane breaks down in the atmosphere much faster than carbon dioxide, and is almost non-existent for much of that period.

The IPCC says that, over a 20-year time horizon, methane is 86 times more potent as a greenhouse gas than carbon dioxide. It has stated:

“There is no scientific argument for selecting 100 years compared with other choices. . . . The choice of time horizon is a value judgement since it depends on the relative weight assigned to effects at different times.” [2]

NASA’s estimate of methane’s potency over a 20-year time horizon is even higher than the IPCC’s, at 105 times that of carbon dioxide. [3]

Figure 1: Breakdown of Methane (CH4) and Carbon Dioxide (CO2) [4]

Methane-and-CO2-sharpened

Methane’s relatively rapid breakdown means that efforts to reduce relevant emissions represent a key climate change mitigation measure. The danger of continuing to mask its true impact by adopting only a 100 year time horizon is that a critical measure can be overlooked or ignored.

Meat Industry Claim: “That said, emissions are one aspect of environmental management and while enormous focus is placed on how to reduce methane production this needs to be done with consideration for impacts on other important environmental factors such as biodiversity.”

My response: Indeed. The Food and Agriculture Organization of the United Nations (FAO) has stated, that livestock production “is one of the major causes of the world’s most pressing environmental problems, including global warming, land degradation, air and water pollution, and loss of biodiversity.” [5]

The FAO has reduced its estimate of livestock’s share of greenhouse gas emissions since that time from 18 to 14.5 percent, but it continues to highlight its serious impacts. (In any event, both emissions figures are conservative for reasons referred to elsewhere in this article.)

Meat Industry Claim: “It is incorrect to suggest there is little room for improvement in reducing emissions associated with beef production. Recent research by CSIRO, State Departments and Universities through the National Livestock Methane Program has demonstrated a number of ways to reduce methane emissions. These include genetic selection for lower emitting bulls and sires, forages selected for lower methane emissions, novel supplements that can be used for lot feeding and investigating of rumen microbes that may be able to be manipulated to reduce emissions.”

My response: As stated in my previous post on this subject, the emissions intensity figures of livestock and plant foods represent different paradigms. Research on animal-based foods is really only tweaking around the edges of the problem.

In my article “The 3 percent diet“, using FAO data as the basis for further calculations, I showed that the global average greenhouse gas emissions intensity of beef from grass-fed cows is 291 kg (kilograms) of emissions per kg of end product. That’s based on the 20-year global warming potential for methane, and relates to the end product, rather than the carcass.

Even if we were to assume that factors such as feed digestibility, management practices, reproduction performance and land use meant that the emissions intensity of Australian grass-fed beef was half the global average, it would still be more than forty times higher than most plant-based alternatives (145 kg versus approximately 3.5 kg). (Please also see the the postscripts below.)

Figure 2: Emissions intensity of various foods with GWP 20 for methane (kg CO2-e/kg of product)

Emissions-intensity

The chart assumes Australian grass-fed beef’s emissions intensity is half the global grass-fed beef average.

Regardless of the emissions intensity of the product, if we are to have any chance of reducing the atmospheric concentrations of carbon dioxide to the critical 350 ppm (parts per million) target suggested by leading climate scientist, Dr James Hansen and colleagues, we must massively reforest. [6] The only way to reforest to the degree required is to reduce the extent of animal agriculture.

We must also reduce emissions of non-CO2 warming agents. Livestock is a critical factor in that regard.

Meat Industry Claim: “The Australian industry accepts its role, along with other agricultural industries including sugar and horticulture to improve the health of the Great Barrier Reef. A grazing best management practices (BMP) program which is backed by the Queensland Government, Agforce and catchment management authorities from reef catchments works with landholders on improving environmental performance, with one benefit being a reduction of run-off onto the reef.”

My response: The 2013 Scientific Consensus Statement of the Queensland government’s Reef Water Quality Protection Plan Secretariat reported that research on pollutants has focussed on suspended solids (sediment), nitrogen, phosphorus and pesticides. [7]

The statement confirmed that grazing areas in the catchment were responsible for the following pollutant loads to the Great Barrier Reef lagoon:

  • 75 percent of suspended solids
  • 54 percent of phosphorus
  • 40 percent of nitrogen

Sugarcane’s main impact, in the form of nitrogen and pesticides, was high relative to the land area involved. The Great Barrier Reef Marine Park Authority has stated, “Grazing of cattle for beef production is the largest single land use on the catchment with cropping, mainly of sugarcane, and urban/residential development considerably less in areal extent.” [8]

The 2012-13 report card on the Reef Water Quality Protection Plan (released in June, 2014) indicated that only 30 percent of graziers had adopted improved land management practices since the plan commenced in 2009. Although it’s pleasing that the figure has increased from the 2011 figure of 11 percent, the figure is still well below a pass mark. It’s also a long way behind horticulture producers at 59 percent and sugarcane growers at 49 percent. [9]

Meat Industry Claim: “The percentage of emissions attributable to the beef industry in Australia has been challenged with various figures presented. The figures that we use are aligned with the Australian Government National Inventory figures, which are built on internationally agreed standards for calculating emissions. Other calculations are not aligned with current international scientific standards used for emissions reporting.”

My response: I commented on this issue in my February, 2013 article Omissions of Emissions: A Critical Climate Change Issue“. [10] I stated that critical under-reporting of livestock’s impact occurs in many “official” figures because relevant factors are omitted entirely, classified under non-livestock headings, or considered but with conservative calculations.

If we want to identify meaningful climate change mitigation opportunities, we must realistically assign emissions to their true source; we are not doing so at present.

One of the items not reported in official greenhouse gas emissions figures, which is relevant to comments that follow on livestock-related land clearing, is the ongoing loss of carbon sequestration caused by the massive amount of such clearing since European settlement.

In any event, even the IPCC excludes critical factors from projections of temperature, sea level rise and the like, so practices such as this in relation to climate change are not new or surprising. All must be challenged if we are to retain a habitable planet. [Footnote]

Meat Industry Claim: “While historically deforestation was a major part of the northern industry’s emission contributions, since 2006 there has been a dramatic reduction in emissions from deforestation. It is incorrect to assume all deforestation occurs for beef production. Emissions related to deforestation has [sic] gone from 140 MT CO2 to 40 MT CO2 between 1990-2014.”

My response: The extent of any sector’s contribution to deforestation will vary over time. For example, extensive clearing occurred for livestock production in Queensland for decades until the then Labor Government banned such clearing (with certain exemptions) with effect from the end of 2006. However, the current Liberal National Party government led by Premier Campbell Newman has recently legislated to again allow significant levels of land clearing. Land that was protected under Labor’s legislation can now be cleared if deemed to be of “high agricultural value”. [11]

A 2003 paper commissioned by the Australian Greenhouse Office reported that 85.1 percent of Australian deforestation during the reference period occurred for livestock production. [12]  In Queensland alone, from 1988 to 2008, around 78,000 square kilometres of land were cleared for livestock. That’s roughly equivalent to 3.3 x 10 kilometre wide tracts of land cleared between Melbourne and Cairns (distance 2,317 km). [13]

Figure 3: Depiction of Queensland land area cleared for livestock 1988-2008

Aust-map

Assume each arrowed line is 10 km wide. 3.3 x 10 km x distance = 78,000 sq km.

With meat exports being a key factor in the new trade agreement between Australia and China, there will be increasing pressure to clear virgin forest and areas of regrowth.

Conclusion

The livestock sector’s greenhouse gas emissions come from factors that are inherent to the industry. As much as the industry and its supporters (including consumers) may like to argue that it can produce sustainably, that will not be possible if we seek to rely on it to adequately feed the world’s current and future human population.

Author:  Paul Mahony (also on Twitter, Scribd, Slideshare and Viva la Vegan)

Footnote: Former Australian of the Year and head of the Climate Council, Professor Tim Flannery, has described IPCC reports as “painfully conservative”. [14] Former senior fossil fuel industry executive and now climate change campaigner, Ian Dunlop, says the IPCC mentions but fails to quantify major risks and related tipping points “caused by non-linear feedback loops, where the climate may flip from one relatively stable state to another far less conducive both to human development and to the economic stability . . .”. [15]

Postscript 8th December, 2014: The emissions intensity chart has been updated to include “Vegetables – Other” (simply described here as “Vegetables”) at 2.2 kg and“Pulses – Other” at 3.5 kg from the relevant Oxford study (Scarborough et al. as referred to in my linked “3 percent diet” article).  They were the highest-rated plant-based foods from that study that I would consider to be part of a staple diet.

Postscript 4th April, 2015: The emissions intensity figure for grass-fed beef attributes all carcass weight emissions to retail cuts of meat. If emissions are also attributed to other products that may be derived from the carcass, utilising fat, bone and the like, then the emissions intensity of the retail cuts will be around 28 percent lower than the figure shown here, namely around 104, rather than 145 kg CO2-e/kg product.

Related articles:Omissions of Emissions: a Critical Climate Change Issue” and “Cowspiracy and the Australian red meat industry

Main Image: Rural scene Cattle sunrise © Clearviewstock | Dreamstime.com

Map: http://www.street-directory.com.au. Used with permission. (Cairns inserted by this author.)

References:

[1]   Romm, J. “More Bad News For Fracking: IPCC Warns Methane Traps Much More Heat Than We Thought”, Climate Progress, 2 Oct 2013, http://thinkprogress.org/climate/2013/10/02/2708911/fracking-ipcc-methane/ citing Intergovernmental Panel on Climate Change, “Climate Change 2013: The Physical Science Basis”, http://www.ipcc.ch/report/ar5/wg1/

[2] Romm, J., ibid.

[3] Schindell, D.T.; Faluvegi, G.; Koch, D.M.; Schmidt, G.A.; Unger, N.; Bauer, S.E. “Improved Attribution of Climate Forcing to Emissions”, Science, 30 October 2009; Vol. 326 no. 5953 pp. 716-718; DOI: 10.1126/science.1174760, http://www.sciencemag.org/content/326/5953/716.figures-only

[4] Image: Smith, K., University of California – Berkeley, cited in World Preservation Foundation, “Reducing Shorter-Lived Climate Forcers through Dietary Change: Our best chance for preserving global food security and protecting nations vulnerable to climate change” (undated), http://www.worldpreservationfoundation.org/Downloads/ReducingShorterLivedClimateForcersThroughDietaryChange.pdf

[5] The Food and Agriculture Organization of the United Nations, “Livestock impacts on the environment”, Spotlight 2006, November 2006, http://www.fao.org/ag/magazine/0612sp1.htm

[6] Hansen, J; Sato, M; Kharecha, P; Beerling, D; Berner, R; Masson-Delmotte, V; Pagani, M; Raymo, M; Royer, D.L.; and Zachos, J.C. “Target Atmospheric CO2: Where Should Humanity Aim?”, 2008, Open Atmos. Sci. J., 2, Supplementary Material, p. xvi, doi:10.2174/1874282300802010217, http://pubs.giss.nasa.gov/docs/2008/2008_Hansen_etal_1.pdf

[7] Kroon, F., Turner, R., Smith, R., Warne, M., Hunter, H., Bartley, R., Wilkinson, S., Lewis, S., Waters, D., Caroll, C., 2013 “Scientific Consensus Statement: Sources of sediment, nutrients, pesticides and other pollutants in the Great Barrier Reef Catchment”, Ch. 4, p. 12, The State of Queensland, Reef Water Quality Protection Plan Secretariat, July, 2013, http://www.reefplan.qld.gov.au/about/scientific-consensus-statement/sources-of-pollutants.aspx

[8] J. Brodie, C. Christie, M. Devlin, D. Haynes, S. Morris, M. Ramsay, J. Waterhouse and H. Yorkston, “Catchment management and the Great Barrier Reef”, pp. 203 & 205, Water Science and Technology Vol 43 No 9 pp 203–211 © IWA Publishing 2001, http://www-public.jcu.edu.au/learningskills/idc/groups/public/documents/journal_article/jcudev_015629~5.pdf and http://www.iwaponline.com/wst/04309/wst043090203.htm

[9] Reef Water Quality Protection Plan, “Report Card 2012 and 2013”, June 2014, http://www.reefplan.qld.gov.au/measuring-success/report-cards/2012-2013-report-card.aspx

[10] Mahony, P., Omissions of Emissions: A Critical Climate Change Issue, Terrastendo, 9th February, 2013, https://terrastendo.net/2013/02/09/omissions-of-emissions-a-critical-climate-change-issue/

[11] Roberts, G, “Campbell Newman’s LNP bulldozing pre-election promise”, The Australian, 1 June, 2013, http://www.theaustralian.com.au/national-affairs/campbell-newmans-lnp-bulldozing-pre-election-promise/story-fn59niix-1226654740183; http://sunshinecoastbirds.blogspot.com.au/2013/06/campbell-newman-takes-axe-to-queensland.html

[12] George Wilkenfeld & Associates Pty Ltd and Energy Strategies, National Greenhouse Gas Inventory 1990, 1995, 1999, End Use Allocation of Emissions Report to the Australian Greenhouse Office, 2003

[13] Derived from Bisshop, G. & Pavlidis, L, “Deforestation and land degradation in Queensland – The culprit”, Article 5, 16th Biennial Australian Association for Environmental Education Conference, Australian National University, Canberra, 26-30 September 2010

[14] Spratt, D, “Global Warming – No more business as usual: This is an emergency!”, Environmental Activists’ Conference 2008: Climate Emergency – No More Business as Usual, 10 October, 2008, reproduced in Links International Journal of Socialist Renewal, http://links.org.au/node/683

[15] Vorath, S. and Parkinson, G., “BHP wants carbon price and more, Dunlop says still not good enough“, Renew Economy, 24th October, 2014, http://reneweconomy.com.au/2014/coal-man-turned-climate-activist-ian-dunlop-second-tilt-bhp-board-92158

Like me, you might be accustomed to seeing percentage figures on posters and elsewhere, indicating livestock’s share of greenhouse gas emissions.

Here’s an image showing a poster from the People’s Climate March in New York in September, 2014.

51-percent-poster-enhanced

I’m not keen on quoting figures indicating livestock’s climate change impacts, unless I can try to explain them. Posters are not a great way to do that.

One problem is that, while environmental processes are dynamic, the figures are often portrayed as if they’re set in stone.

Another problem is that the figures depend on whichever factors have been taken into account, which can vary significantly from one report to another.

I commented on that issue in my February, 2013 article Omissions of Emissions: A Critical Climate Change Issue“. [1] I stated that critical under-reporting of livestock’s impact occurs  in many “official” figures because relevant factors are omitted entirely, classified under non-livestock headings, or considered but with conservative calculations.

An example of the latter is methane’s impact based on a 100-year, rather than 20-year, global warming potential(GWP). Methane is many times more potent than carbon dioxide as a greenhouse gas, and more so over a 20 year time horizon than 100 years. More on that below.

So while figures are often portrayed as being absolute, they should ideally be qualified so as to explain how they have been arrived at. That might not be very practical, but the issues are complex and cannot always be conveyed appropriately with just a few words or numbers.

Some prominent claims 

Livestock reported to be responsible for 18 percent of emissions (which is more than transport)

In its 2006 “Livestock’s Long Shadow” report, the Food and Agriculture Organization of the United Nations (FAO) stated that livestock’s emissions represented 18 percent of the global total in the 2005 reference period. The figure was said to be higher than transport’s share. [2]

In September 2013, the FAO reduced its estimate of livestock’s share to 14.5 percent, yet that figure seems to have received relatively little attention. [3] As with “Livestock’s Long Shadow”, the reference period was 2005, but the assessment methodology had been amended. [4] The reasoning was that the FAO had used or relied on different methods for assessing the relative emissions of livestock and transport. In other words, they had not compared “apples with apples”. [5]

Despite the amended approach, both the 2006 and 2013 reports included emissions from fertiliser and feed production, land clearing, manure management, enteric fermentation (producing methane in the animal’s digestive system) and transportation of livestock animals and their feed. Both were based on the conservative 100-year GWP for methane.

Livestock reported to be responsible for at least 51 percent of emissions

The suggestion that livestock are responsible for at least 51 percent of the world’s greenhouse gas emissions came from a 2009 World Watch magazine article by Robert Goodland and Jeff Anhang. [6] Goodland was the lead environmental adviser to the World Bank, and Anhang is a research officer and environmental specialist at the World Bank’s International Finance Corporation.

The article was effectively a critique of “Livestock’s Long Shadow”, with amended figures reflecting the authors’ concerns over the report.  The authors took into account various factors, including: livestock respiration; 20-year GWP for livestock-related methane; and some allowance for foregone carbon sequestration on land previously cleared.

1. Livestock respiration

The authors argued that livestock respiration was overwhelming photosynthesis in absorbing carbon due to the massive human-driven increase in livestock numbers and removal of vegetation. Goodland subsequently stated, “In our assessment, reality no longer reflects the old model of the carbon cycle, in which photosynthesis balanced respiration”. [7]

Some have argued against the inclusion of respiration. Based on my calculations, by excluding that factor, the analysis would have indicated that livestock’s emissions represented 43 percent of the global total.

2. Methane

Goodland and Anhang applied a 20-year GWP to livestock-related methane emissions, which is particularly relevant to: (a) potential near-term climate change tipping points; and (b) identification of relatively rapid mitigation measures.

Methane breaks down in the atmosphere relatively quickly, with little remaining after 20 years. As a result, a 100-year GWP greatly understates its shorter-term impact.

Even methane’s near-term impacts can become long-term and irreversible to the extent that they contribute to us reaching tipping points and runaway climate change.

Comments from the IPCC, cited by respected climate change commentator, Joseph Romm, reflect the validity of using a 20-year GWP:

“There is no scientific argument for selecting 100 years compared with other choices (Fuglestvedt et al., 2003; Shine, 2009). The choice of time horizon is a value judgement since it depends on the relative weight assigned to effects at different times.” [8]

A possible cause for concern in this case is that the authors did not adopt the same approach for non-livestock methane emissions. Goodland has since stated, “Because we questioned many aspects of the FAO’s work, we were reluctant to use their figures for methane, but did so anyway for livestock methane because we couldn’t find a more reliable figure”. [9] 

Goodland has argued that the impact of such an approach would have been more than offset by the fact that the number of livestock animals they based their assessments on (being the number used in “Livestock’s Long Shadow”) was far below the figure of 56 billion that the FAO’s statistical division had reported in 2007. He and Anhang became aware of the higher figure after their article was published.

The authors used the IPCC’s GWP estimate of 72 that applied at the time of the article. The IPCC has since increased the figure to 86 (incorporating carbon cycle feedbacks), while NASA estimates a figure of 105. [10]

With the rapid increase in extraction of unconventional fossil fuels since 2005, the growth in other anthropogenic sources of methane may have caused livestock’s share of emissions to reduce from what it would otherwise have been.

3. Foregone sequestration

The FAO allowed for emissions from land clearing in the year such changes occurred, with loss of carbon from vegetation and soil. However, it did not allow for the resultant ongoing loss of carbon sequestration.

Goodland and Anhang sought to allow for that factor to some extent. They suggested the possibility of allowing land that has been cleared for livestock grazing or feed crop production to regenerate as forest, thereby mitigating “as much as half (or even more) of anthropogenic GHGs” [greenhouse gases]. They argued that the land could, alternatively, be used to grow crops for direct human consumption or crops that could be converted to biofuels, thereby reducing our reliance on coal. They used the biofuel scenario in their calculations, incorporating the greenhouse gas emissions from the coal that is continuing to be used in lieu of the biofuels.

Goodland’s response to feedback to the 2009 World Watch article can be seen in his March/April, 2010 article, ‘Livestock and Climate Change’: Critical Comments and Responses (referred to above).

Australian Emissions

Estimates of animal agriculture’s share of Australian emissions range from the official figure of around 10 percent to 49 percent.

The Australian government’s 2012 National Inventory Report used a figure of 10.9 percent, representing the aggregate of: (a) enteric fermentation in the digestive systems of ruminant animals; and (b) manure management. The figure was based on a 100-year GWP for methane. [11]

The 49 percent figure is from the land use plan released in October 2014 by Beyond Zero Emissions and Melbourne Sustainable Society Institute (The University of Melbourne). The figure allows for factors such as: a 20-year GWP; livestock related land clearing and subsequent soil carbon loss; and livestock related non-carbon dioxide warming agents such as carbon monoxide and tropospheric ozone. [12]

The overall figure for animal agriculture may actually be higher than 49 percent using BZE’s calculations, as they have reported it solely in relation to rangeland grazing. However, their figure for all agriculture is only marginally higher, at 54 percent.

Cowspiracy: some modification may be beneficial

The documentary film Cowspiracy: The Sustainability Secret focuses on the environmental impacts of animal agriculture. Those behind it seem to have significantly raised community  awareness of this critical issue. [13]

I am yet to see the film, but have reviewed the climate change material from its website.

At the time of writing, the site’s “facts” page shows the FAO’s 2006 figure of 18 percent for animal agriculture. A footnote has been added, confirming the FAO’s 2013 estimate of 14.5 percent, as referred to above.

The page then states (with my underline), “livestock and their byproducts actually account for . . . at least 51 percent of all worldwide greenhouse gas emissions”.

The word “actually” implies an absolute, definitive figure, with none of the qualifying comments of the type I have referred to above. I am uncomfortable with the thought of relying on the figure in that way.

The site also indicates that “methane is 25-100 times more destructive than CO2” and “methane has a global warming power 86 times that of CO2”.

Both statements appear to be referring to methane’s GWP (global warming potential).

The presentation referred to for the figure of 86 is attributed to Erika Podest of NASA’s Jet Propulsion Laboratory. [14] However, it does not seem to refer to that figure, which is the IPCC’s current 20-year GWP after allowing for carbon cycle feedbacks. (Without those feedbacks, the IPCC’s current estimate is 84.)

Instead, the presentation refers to a GWP of 25 (slide 8), which is the 100-year figure from the IPCC’s 2007 Fourth Assessment Report. In its Fifth Assessment Report from 2013, the IPCC used a figure of 34.

The referenced article for the figures of 25-100 actually indicates an upper figure of 105. Perhaps ironically, it comes from NASA researchers. [10]

Please also see the postscript of 16th November, 2014 below.

The main message

Regardless of which approach is adopted, the key message must be that we will not overcome climate change without urgent action on both fossil fuels and animal agriculture.

The precise percentage share of the many contributors to greenhouse gas emissions matters little in that context.

An alternative poster

Here’s my contribution to the world of posters, which I like to believe accurately represents our current position.

The-ultimate-inconvenient-truth

Additional Comments

A large proportion of the organisations that partnered with the FAO in reviewing its methodology were major participants in the livestock sector. They included the European Feed Manufacturers’ Federation, the International Dairy Federation, the International Meat Secretariat, the International Egg Commission, and the International Poultry Council. [15]

The FAO is now indicating that meat consumption will increase by more than 70 percent by 2050, and has suggested various approaches for reducing relevant emissions. However, any improvement in the emissions intensity of production would be marginal relative to the reductions that could be achieved by a general move toward plant-based products.

The partnership also included the World Wildlife Fund (WWF), which has been accused of working with major business organisations that allegedly use the WWF brand to help improve their green credentials, while acting against the interests of the environment. [16]

As I have reported elsewhere, the partnership was chaired by Dr. Frank Mitloehner of the University of California, Davis, who has disclosed research funding from the National Cattlemen’s Beef Association. [17]

Author:  Paul Mahony (also on Twitter, Scribd, Slideshare and Viva la Vegan)

Related articles:Omissions of Emissions: a Critical Climate Change Issue” and “Cowspiracy and the Australian red meat industry

Postscript 16th November, 2014: I will comment elsewhere on other aspects of Cowspiracy’s “facts” page. However, one I will mention here is the suggestion that cows emit methane through “farting”. The cited article from the International Business Times appears to be incorrect in that regard, as the emissions primarily occur through belching, with a relatively small amount released from “manure management” (being a category specified in the National Greenhouse Accounts). It may seem a trivial issue, but I am concerned that it can appear within a page that people refer to as an authoritative resource. It also reinforces a major misconception about livestock’s emissions that causes many people to laugh them off.

Postscript 7th November 2021: The final image has been updated with one I used on my other website, Planetary Vegan.

Images:

Image from the People’s Climate March from video on the Facebook page of “Cowspiracy: The sustainability secret”, https://www.facebook.com/video.php?v=288706614654201

Final poster image © Gkuna | Dreamstime.comGrazing Cows Photo

References:

[1] Mahony, P., Omissions of Emissions: A Critical Climate Change Issue, Terrastendo, 9th February, 2013, https://terrastendo.net/2013/02/09/omissions-of-emissions-a-critical-climate-change-issue/

[2] Food and Agriculture Organization of the United Nations, 2006 “Livestock’s Long Shadow – Environmental Issues and Concerns”, p. xxi, Rome, http://www.fao.org/docrep/010/a0701e/a0701e00.HTM (Related FAO articles at http://www.fao.org/ag/magazine/0612sp1.htm; and http://www.fao.org/newsroom/en/news/2006/1000448/)

[3] Food and Agriculture Organization of the United Nations, 26th September, 2013, “Major cuts of greenhouse gas emissions from livestock within reach”, http://www.fao.org/news/story/en/item/197608/icode/

[4] Food and Agriculture Organization of the United Nations, “Methodology: Tackling climate change through livestock”, http://www.fao.org/news/story/en/item/197644/icode/

[5] Brainard, C., “Meat vs Miles”, The Observatory, 29th March, 2010, http://www.cjr.org/the_observatory/meat_vs_miles.php?page=all

[6] Goodland, R & Anhang, J, “Livestock and Climate Change – What if the key actors in climate change are cows, pigs, and chickens?”, World Watch, Nov/Dec, 2009, pp 10-19, http://www.worldwatch.org/files /pdf/Livestock%20and%20Climate%20Change.pdf

[7] Goodland, R., “Lifting lifestock’s long shadow”, Nature Climate Change 3, 2 (2013) doi:10.1038/nclimate1755, Published online 21 December 2012, http://www.nature.com/nclimate/journal/v3/n1/full/nclimate1755.html and http://www.readcube.com/articles/10.1038/nclimate1755

[8] Intergovernmental Panel on Climate Change, Fifth Assessment Report, 2014, http://www.ipcc.ch/report/ar5/, cited in Romm, J., “More Bad News For Fracking: IPCC Warns Methane Traps More Heat”, The Energy Collective, 7th October, 2013, http://theenergycollective.com/josephromm/284336/more-bad-news-fracking-ipcc-warns-methane-traps-much-more-heat-we-thought

[9] Goodland, R., “‘Livestock and Climate Change’: Critical Comments and Responses”, World Watch, Mar/Apr, 2010, http://www.chompingclimatechange.org/uploads/8/0/6/9/8069267/livestock_and_climate_change_critical_comments_and_responses.pdf

[10] Schindell, D.T.; Faluvegi, G.; Koch, D.M.; Schmidt, G.A.; Unger, N.; Bauer, S.E. “Improved Attribution of Climate Forcing to Emissions”, Science, 30 October 2009; Vol. 326 no. 5953 pp. 716-718; DOI: 10.1126/science.1174760, http://www.sciencemag.org/content/326/5953/716.figures-only

[11] Australian National Greenhouse Accounts National Inventory Report 2012, Volume 1, pp. 39 and 257, http://www.environment.gov.au/climate-change/greenhouse-gas-measurement/publications/national-inventory-report-2012

[12] Beyond Zero Emissions and Melbourne Sustainable Society Institute, The University of Melbourne, “Zero Carbon Australia, Land Use: Agriculture and Forestry Discussion Paper”, p. 68 & 97, October, 2014, http://bze.org.au/landuse

[13] “Cowspiracy: The Sustainability Secret”, http://www.cowspiracy.com/

[14] Podest, E., “Methane: its role as a greenhouse gas”, Greenhouse Gases Professional Development Workshop, Jet Propulsion Laboratory, Pasedena, California, 21st April, 2012, http://www.jpl.nasa.gov/education/pdfs/podest_ghg.pdf, cited in “Cowspiracy: The Facts”, http://www.cowspiracy.com/facts/

[15] Food and Agriculture Organization of the United Nations, “New effort to harmonize measurement of livestock’s environmental impacts”, 4th July, 2012, http://www.fao.org/news/story/en/item/150555/icode/

[16] Huismann, W., Panda Leaks: the dark side of the WWF“, cited in Vidal, J., “WWF International accused of ‘selling its soul’ to corporations”, The Guardian, 4th October, 2014, http://www.theguardian.com/environment/2014/oct/04/wwf-international-selling-its-soul-corporations

[17] Goodland, R., FAO’s New Parternship with the Livestock Industry“, Chomping Climate Change, 20th July, 2012, http://www.chompingclimatechange.org/blog/faos-new-parternship-with-the-livestock-industry

??????????????????????????????????????????????????????????????????????????????????????????????????????????

Note from author

For more up to date material in relation to “Cowspiracy”, please see my article An industry shooting itself in the foot, which consolidates and expands on material from this article and the article More on Cowspiracy and the Australian red meat industry.

Article: “Cowspiracy and the Australian red meat industry”

“Cowspiracy” is a documentary film focussing on the environmental impacts of animal agriculture. I am yet to see it, but organisations within the Australian red meat industry have posted comments about it on their Target 100 website.

In this post, I provide a preliminary response to the red meat industry’s claims. Those claims focus on the supposed difference between Australian and US meat production, and do not appear to require me to have seen the film in order to comment.

In 2012, I commented on claims made by Meat & Livestock Australia (MLA) on two websites that no longer exist. The web addresses currently link to the Target 100 website. My comments from that time can be seen in my article,Comments on Meat & Livestock Australia’s ‘Myth Busters’ and Other Claims“.

MLA’s partners on the Target 100 website are: Australian Lot Feeders Association; Sheep Meat Council of Australia; Cattle Council of Australia; and Australian Meat Industry Council.

Why is Australian beef different?

Meat Industry Claim: Cowspiracy focuses on the amount of land cleared in the Amazon to produce grain for cattle.  Australian farmers do not buy grain from the Amazon.

My response: As I have reported elsewhere, animal agriculture has been by far the major cause of land clearing in Australia. The gross and inherent inefficiency of animals as a food source causes us to use far more land than would otherwise be required.

Australia’s Chief Scientist has reported: “Based on data from typical perennial grasslands and mature forests in Australia, forests are typically more than 10 times as effective as grasslands at storing carbon on a hectare per hectare basis.”

The emissions performance of pasture degraded by livestock grazing would be far worse than indicated by that statement.

Meat Industry Claim: In Australia, most cattle graze on grass.  Even “grain fed” cattle spend most of their lives grazing grass.  At any one time, only around 2% of Australia’s cattle population is in feedlots.

My response: Beef from grass-fed cows is far more emissions intensive than grain-fed, as referred to in my articles “Some myths about meat” and “The 3 percent diet“.

Between regions, the emissions intensity of beef and other products can vary significantly, with factors such as feed digestibility, herd management practices, reproduction performance, and land clearing playing a part. According to the UN Food & Agriculture Organization (FAO), based on the factors they allowed for, Oceania’s performance (including Australia) is only marginally better than North America’s (including USA). Allowing for other factors, it may be far worse. I refer to some of them here in relation to Australia only.

Meat Industry Claim: In Australia, grain fed to livestock is either ‘feed grain’ quality, or grown solely for livestock consumption. Cattle are not consuming grains that humans can eat.

My response: The resources (including land) used to grow grain for cattle have many possible alternative uses, including grain production for humans or regeneration of natural habitat, helping to draw down existing atmospheric carbon as a critical climate change mitigation measure.

Meat Industry Claim: Australia’s livestock industry produces approximately 10 per cent of Australia’s total greenhouse gas emissions. Most of this is methane produced by the natural digestion process of cattle and sheep. Find out what the Australian industry is doing to research emissions reduction here.

My response: As I reported in my article “Omissions of Emissions: a Critical Climate Change Issue“, the figure of 10% is based solely on enteric fermentation in the digestive systems of ruminant animals (producing methane), and manure management (producing methane and nitrous oxide). Livestock-related land clearing and other factors are not allowed for. Based on 2008 numbers, I calculated a figure of 29.6% after allowing for a 20-year “global warming potential” (GWP) for methane and livestock-related land clearing and savanna burning.

In its recently released land use report, environmental group Beyond Zero Emissions arrived at a figure of 26% for 2010 after allowing for those factors. Additionally, taking into account emissions such as carbon monoxide and tropospheric ozone, they have estimated that emissions from Australian beef and sheep meat production represent around 49% of total national emissions. (Initial comments from BZE land use researcher, Gerard Wedderburn-Bisshop, in relation to the Target 100 article can be seen here.)

Meat Industry Claim: Using arid land for grazing cattle may actually be positive in Australia. See conservationist Dr Barry Trail [sic] TEDxSydney talk about this here.

My response: If Barry Traill’s approach is based on that of Allan Savory, then there is cause for concern. I need to review Traill’s approach further. I have commented on Savory’s methods in my article “Livestock and Climate: Why Allan Savory is not a saviour” and in an article about the founder of 350.org, Bill McKibben, “Do the math: there are too many cows“.

[Update 11th August, 2015: Please see item #1 of my 21st February, 2015 article “An industry shooting itself in the foot” for detailed comments on Dr Traill’s TEDx presentation.]

Meat Industry Claim: The Australian cattle and sheep industry invests around $13 million annually in research, development and extension programs to improve environmental performance. Find out more here.

My response: The emissions intensity figures of livestock and plant foods represent different paradigms. Research on animal-based foods is really only tweaking around the edges of the problem.

Meat Industry Claim: Australian production efficiencies have delivered a 5.3% reduction in emissions per tonne of beef produced since 1990 (Calculated using 2010 beef production data from MLA and from the 2009 National Greenhouse Gas Inventory).

My response: Refer to the previous response.

Meat Industry Claim: Life Cycle Assessment on Australian beef and lamb production systems showed that Australia has one of the lowest carbon emission profiles of any major meat-producing country.  The research was undertaken by the University of New South Wales in 2009.

My response:

The relevant paper notes that it was funded by MLA.

A key omission seems to be any reference to land clearing. The figures also exclude (unlike some life cycle assessments) emissions “associated with transport after the meat processing plant and other processing, retailing, or consumption activities”. The system boundary “encompasses all on-site and upstream processes at the farm, feedlot, and whole processing plant, including transport between these sites”.

Even with the shortcomings referred to above, the researchers reported emissions intensity figures (CF per kg of carcass) of 9.9 for grain-finished beef and 12.0 for grass-finished. If it is assumed that 72% of the carcass is usable, then the figures would become 13.75 for grain-finished beef and 16.7 for grass-finished beef.

Those results are still very poor compared to grains, vegetables and other products, and similar to aluminium which has at times consumed 16% of Australia’s (mainly coal-fired) electricity in the production process. They would be far worse if other factors referred to in this article, such as a 20-year GWP for methane, were factored in.

As a comparison, adjusting figures from the FAO for yield and a 20-year GWP, the emissions intensity of specialised beef in Oceania (which includes Australia) would be around 100 kg CO2-e/kg of product, while the figure for grass fed beef would exceed that figure.

What are the other problems with Cowspiracy?

Meat Industry Claim: Cowspiracy bases its arguments on the 2006 FAO Livestocks Long Shadow report, which claimed the sector contributes more greenhouse gas (GHG) than the entire transport sector. This statement has been retracted by the paper authors who have since accepted that the paper used two different methodologies to calculate greenhouse gas emissions, resulting in an unfair comparison to the beef industry. FAO  livestock policy officer Pierre Gerber told BBC News he accepted the criticism: “I must say honestly that he [Professor Mitloehner, UC Davis] has a point; we factored in everything for meat emissions, and we didn’t do the same thing with transport”. In Australia, energy generation represents 37 per cent of Australia’s emissions, compared to 10 per cent for livestock.

My response: Note comments above, indicating that the figure of 10 percent for Australia can be considered to be understated or overly conservative in many respects.

In 2013, the FAO revised its figure for livestock from 18 percent to 14.5 percent, and no longer compared it to transport. The former lead environment adviser to the World Bank, the late Robert Goodland, had been extremely critical of the FAO’s association with livestock industry bodies such as the International Meat Secretariat and the International Dairy Federation in reviewing its position. (Goodland was co-author, with Jeff Anhang, of a 2009 Worldwatch Magazine article on livestock’s climate change impacts, which I have referred to elsewhere.)

He was also critical in relation to the the appointment of Frank Mitloehner as chair of the new partnership formed to further assess livestock’s performance. He stated, “In fact, it would be good for the FAO to explain why it decided that the best choice as chair of its new partnership is Frank Mitloehner, an associate professor who has disclosed that his research has been funded by the National Cattlemen’s Beef Association. He is not a specialist in environmental assessment, while good practice in environmental assessment is to employ independent environmental assessment practitioners.”

Regardless of those concerns, the figure of 14.5% is a significant yet conservative estimate of livestock’s impact. (Please also see “other considerations” below.)

Meat Industry Claim: Cowspiracy deals only with beef production in the United States. The grain-fed system in the US is quite different from the grass and grain-fed industry in Australia, where cattle that are grain fed spend only 10-15 per cent of their lives in feedlots.

My response: Cows have evolved to eat grass, and grain-feeding is generally reserved for the later stages of their lives, as they would not survive for long on grains alone. As indicated above, grass-fed cows generally produce more emissions than grain-fed.

Meat Industry Claim: Cowspiracy alleges that no environmental group is looking at the beef industry due to the political power of the industry. This is the “conspiracy”. In fact, many environment groups focus their activism on the beef industry. The film even shows the logo for WWF, which has a very public program looking at the global beef industry through the Global Roundtable for Sustainable Beef.

My response: See my comments above about tweaking around the edges. A transformational change of diet is required, rather than a search for “sustainable beef”, which is a term I regard as an oxymoron in the context of our current environmental emergencies, including climate change.

In any event, the World Wildlife Fund (WWF), has been accused of working with major business organisations that allegedly use the WWF brand to help improve their green credentials, while acting against the interests of the environment.

Further considerations

The red meat industry can argue that aspects of its operations are more environmentally friendly than portrayed in Cowspiracy. However, any improvement will be relatively minor relative to what is required to overcome climate change.

If we are to have any chance of reducing the atmospheric concentration of carbon dioxide to the critical 350 ppm target suggested by leading climate scientist, Dr James Hansen and colleagues, then we must objectively and realistically address the issues of our reliance on fossil fuels, as well as reforestation, soil carbon and non-carbon dioxide warming agents, such as methane, nitrous oxide and black carbon. The essential role of coal, forestry and soil in achieving the target is demonstrated in the image below, from Hansen et al’s “Target Atmospheric CO2: Where Should Humanity Aim?” paper.

The only way to meaningfully reforest in the context of the climate emergency is to reduce the extent of animal agriculture.

Figure 1: CO2 Emissions and Atmospheric Concentration with Coal Phaseout by 2030

Hansen-target-atmospheric-co2

By the time the 350 ppm target could be achieved with action on land clearing and soil carbon (around 2090 based on IPCC’s estimates of oil and gas reserves and assuming an end to non-sequestered coal use by 2030), it would fall short at around 380 ppm if we were to ignore those factors. If we did so, then the target would not be achieved until well beyond 2150.

The role of agriculture, forestry and reductions in non-CO2 greenhouse gases (of which animal agriculture is a critical component) was highlighted in this extract from Hansen et al’s paper:

A reward system for improved agricultural and forestry practices that sequester carbon could remove the current CO2 overshoot. With simultaneous policies to reduce non-CO2 greenhouse gases, it appears still feasible to avert catastrophic climate change.

Conclusion

The red meat industry’s attempts to discredit Cowspiracy remind me of the denialist lobby’s attempts to thwart meaninful action on climate change generally. Precious time and energy will be diverted in any debate, when we must act urgently to address the problem.

We need to properly account for the true environmental cost of the industry’s products in the price paid by consumers, thereby creating price signals that will direct those consumers to the most environmentally beneficial products. We must also inform the community of the issues, as efficient markets require well informed participants.

We either want to retain a habitable planet or we do not. The choice is ours.

Author:  Paul Mahony (also on Twitter, Scribd, Slideshare and Viva la Vegan)

Please also see: More on Cowspiracy and the Australian red meat industry

Image: Australian herd of beef cattle live animals © Sheryl Caston | Dreamstime.com

Notes:

A reference list will be added.

Updates:

Comments on WWF added on 14th November, 2014. Source: Huismann, W., Panda Leaks: the dark side of the WWF“, cited in Vidal, J., “WWF International accused of ‘selling its soul’ to corporations”, The Guardian, 4th October, 2014, http://www.theguardian.com/environment/2014/oct/04/wwf-international-selling-its-soul-corporations

Comments on the Life Cycle Assessment were amended on 23rd February, 2015, including reference to FAO figures. The FAO reference is Food and Agriculture Organization of the United Nations, “Greenhouse gas emissions from ruminant supply chains: A global life cycle assessment”, Nov 2013, Fig. 12, p. 30,  http://www.fao.org/ag/againfo/resources/en/publications/tackling_climate_change/index.htm; http://www.fao.org/docrep/018/i3461e/i3461e.pdf

A related FAO reference (relevant to other comments within this article) is Food and Agriculture Organization of the United Nations, “Tackling climate change through livestock: A global assessment of  emissions and mitigation opportunities”, Nov 2013, http://www.fao.org/ag/againfo/resources/en/publications/tackling_climate_change/index.htm; http://www.fao.org/docrep/018/i3437e/i3437e.pdf