
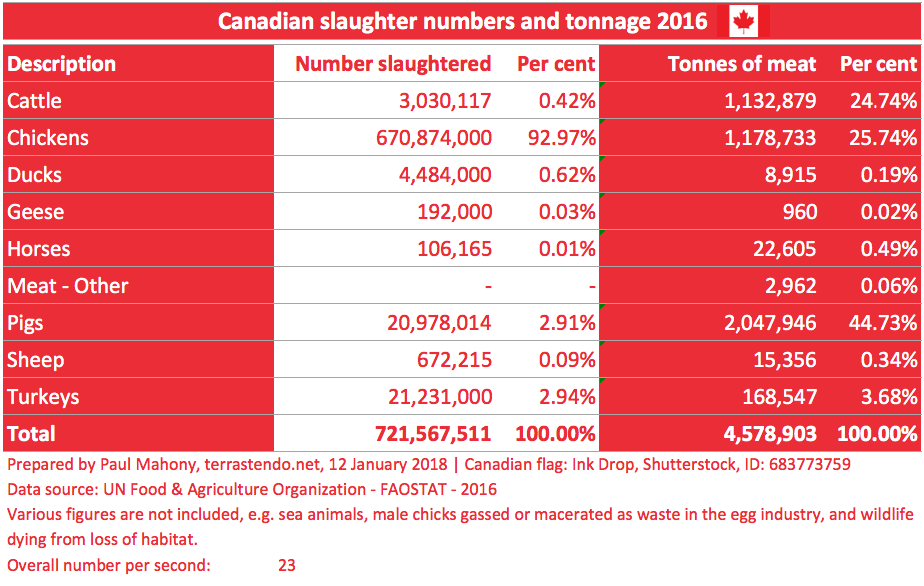
The following table and charts depict the extent of land animal slaughter and meat production from 1961 to 2016. They are based on data from the UN Food and Agriculture Organization and the World Bank. The FAO does not publish figures for all species, as referred to in the notes, but hopefully the information gives some of idea of the staggering, almost unimaginable scale of the animal holocaust.
These figures are for Canada. Please see other pages for tables and charts for the World, Australia, China, New Zealand, UK, and the USA.


Image
James Wheeler, “Brown Cow”, Flickr, Attribution-NonCommercial-ShareAlike 2.0 Generic (CC BY-NC-SA 2.0). Taken on Saturna Island, British Columbia, Canada

