The following table and charts depict the extent of land animal slaughter and meat production from 1961 to 2016. They are based on data from the UN Food and Agriculture Organization and the World Bank. The FAO does not publish figures for all species, as referred to in the notes, but hopefully the information gives some of idea of the staggering, almost unimaginable scale of the animal holocaust.
These figures are for the USA. Please see other pages for tables and charts for the World, Australia, China, New Zealand, UK and Canada.
Some background
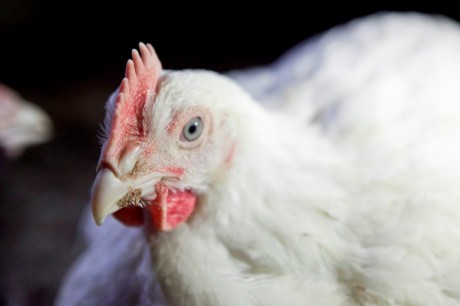
Animals suffer equally around the world. Chickens born and raised for food live a life of hell. The almost unimaginable suffering is compounded by a general transition in many countries away from from eating the flesh of cattle and sheep toward eating the flesh of chickens, with a multiplying of the overall cruelty footprint. For example, in the USA, based on the relative average yields of meat, 182 chickens are required to replace one cow.
Another perspective
Images
vborodinova, Pixabay, CC0, Creative Commons


