Archives for posts with tag: sustainability

shutterstock_662196295

Foreword

This article first appeared on the Viva la Vegan website on 7th February, 2012 with the title “Solar or Soy, which is better for the planet, Part 2“. The title reflected the fact that it was an introduction to subsequent articles on the great elephant in the room of climate change, animal agriculture, but it did not deal with that issue specifically.

The contents of this article are very relevant to our current climate change crisis, which (not surprisingly) reflects a significant deterioration since the article was published. Awareness and concern about the issue seem to have increased enormously since then, but do we have the time or the political will to turn the juggernaut around and retain a habitable planet?

Should the deterioration in the state of our climate come as a surprise?

Perhaps not when you consider the existence of climate feedback mechanisms and the fact that, between 1998 and 2013, the oceans had been gaining heat at a rate equivalent to about four Hiroshima atomic bombs per second. Worse still, the rate had suddenly increased to around twelve per second during 2013. [1] Between 1998 and early 2015, those rates resulted in heat equivalent to more than two billion Hiroshima bombs being accumulated. [2]

Hiroshima-2

There are substantial year-on-year variations in heat uptake by the oceans, but even at a rate of four Hiroshima bombs per second, why wouldn’t the planet’s climate system move away from the relatively benign conditions that had been experienced during the 10,000 years of human civilisation? Of particular note is the fact that the current concentration of atmospheric greenhouse gases is more than thirty percent higher than at any time in at least the last one million years. [3]

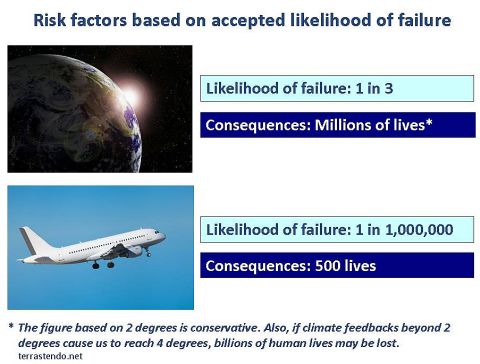
Climate change author David Spratt, whose work is featured in the article, recently cited leading US climate scientist Dr Michael E. Mann, who has reported that new calculations “indicate that if the world continues to burn fossil fuels at the current rate, global warming will rise to 2C° by 2036”. [4] By the time that temperature has been reached, key climate change tipping points are likely to have been breached, creating a very real risk of even higher temperatures and runaway climate change over which humans will have little or no control. [5]

Our efforts to avoid such a scenario are limited by the fact that we have created a potentially tragic Catch-22 in the form of aerosols generated by the burning of fossil fuels. Aerosols are airborne particulates such as sulphates, nitrates, and dust from smoke and manufacturing. They have a cooling effect, sometimes referred to as “global dimming”, which has offset some of the warming effects of greenhouse gases. They only remain in the atmosphere for around ten days, so their cooling impact will be short-lived in any transition away from fossil fuels to less carbon-intensive energy sources. This dilemma is referred to by David Spratt and Dr James Hansen as a “Faustian bargain”, alluding to Doctor Faustus of folklore and legend, who sold his soul to the devil in exchange for knowledge and power. Based on research from organisations such as NASA and CSIRO, Spratt has suggested that aerosol cooling is in the range of 0.5-1.2°C. [6]

Introduction

In Part 1 of this series (Solar or Soy, Part 1), I wrote of the dramatic increase in atmospheric concentrations of carbon dioxide and other greenhouse gases since the beginning of the industrial revolution, and the accelerating pace of such increases in recent times.

In this article, I outline the impact of such changes in terms of tipping points, runaway climate change and the need for emergency action.

The current situation in regard to climate change could hardly be more dire. Paradoxically, the response from decision makers, relative to the dangers, could hardly be more muted. I will comment on the lack of an effective response in a future article.

I feel the need to report on these issues in the same way that I would feel the need to scream out to people who were in danger of being hit by a truck careering towards them, of which they were unaware. Alerting them to the impending danger may enable them to save themselves.

In addition to impacts on the current human population of our planet, we must also consider future generations and other species.

As a reminder of the rapid growth in greenhouse gases, here is a chart depicting the increase in carbon dioxide concentrations since 1960:

Figure 1: Levels of atmospheric carbon dioxide [7]

Mauna-Lao-emissions

Remember that carbon dioxide concentrations never exceeded 300 ppm (parts per million) in the previous 1,000,000 years. They have increased from around 315 ppm to around 390 ppm in just 50 years.

Over the past ten years, the average annual rate of increase was 2.07 ppm, which is more than double the rate of increase in the 1960s. [8]

On the Edge of a Precipice

David Spratt is a co-author (with Philip Sutton) of a groundbreaking book published in 2008, entitled “Climate Code Red: The case for emergency action”.

Subsequent to the book’s release, he commented as follows:

“ . . . the world stands . . . on the edge of a precipice . . . beyond which human actions will no longer be able to control in any meaningful way the trajectory of the climate system . . .” [9]

The precipice that David Spratt referred to derives from amplifying feedbacks in the climate system, causing us to approach tipping points beyond which catastrophic climate change is almost certain unless dramatic mitigation efforts commence without delay (assuming it is not already too late.)

In the words of Dr James Hansen, Director of NASA’s Goddard Institute for Space Studies and an adjunct professor in the Department of Earth and Environmental Sciences at Columbia University [Footnote 1]:

“Tipping points occur because of amplifying feedbacks – as when a microphone is placed too close to a speaker, which amplifies any little sound picked up by the microphone, which then picks up the amplification, which is again picked up by the speaker, until very quickly the noise becomes unbearable.” [10]

Figure 2: Feedbacks in a sound system [11] and in human-induced climate change [12]

acoustic_feedback_mechanism

Feedbacks-CSIRO

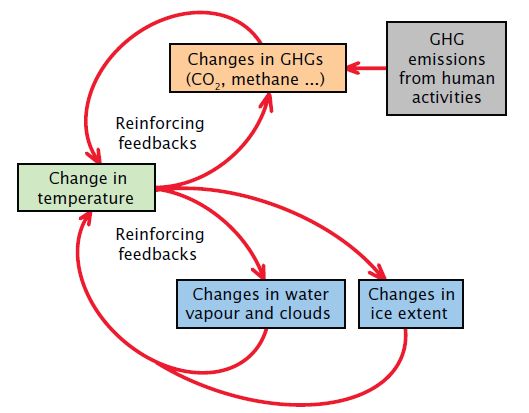
In the second image, the release of greenhouse gases (GHGs) increases temperatures, which in turn:

  1. increase the level of water vapour (a powerful greenhouse gas) through evaporation, along with the air’s capacity to hold that water vapour;
  2. reduce the area of ice sheets; and
  3. release GHGs from (for example) melting permafrost.

Each of those reactions (some of which I expand on below) then warms the atmosphere further, causing the process to continue and amplify.

Here are some further comments on the issue:

Dr James Hansen, 2009 [13]:

“How can we be on the precipice of such consequences while local climate change remains small compared to day-to-day weather fluctuations? The urgency derives from the nearness of climate tipping points, beyond which climate dynamics can cause rapid changes out of humanity’s control.”

Commonwealth Scientific and Industrial Research Organisation (CSIRO)

2010: “The further climate is pushed beyond the envelope of relative stability that has characterised the last several millennia, the greater becomes the risk of passing tipping points that will result in profound changes in climate, vegetation, ocean circulation or ice sheet stability.” [14]

2011: “Climate change does not proceed smoothly for a given change in radiative forcing from changing greenhouse gas levels. There is a risk of abrupt changes as the climate shifts from one state to another as a result of feedbacks in the climate system. . . . Their hazard lies in the fact that, once they have occurred, it may be hard for the planet to return to its previous steady state. For example, once Greenland’s ice cap is committed to melting it is unlikely to reform for thousands of years, leading eventually to sea level rises of several metres. [15]

International Energy Agency 2011(as reported by the Huffington Post):

The world is on the brink of irreversible climate change, according to a report released on Wednesday by the International Energy Agency (IEA). Called the World Energy Outlook 2011, the analysis is the most thorough ever produced on the effects of releasing fossil fuels into the atmosphere. According to the research, in five years global warming will hit a point of no return after which it will be impossible to reverse the process.” [16]

Professor Barry Brook, Sir Hubert Wilkins Chair of Climate Change, The University of Adelaide, as reported in 2008:

“Two degrees has the potential to lead to three or four degrees because of carbon-cycle feedbacks.[17] [Footnote 2]

Shortcomings in some conventional measures of potential climate change impacts

The IPCC (Intergovernmental Panel on Climate Change) has considered fast feedbacks in establishing relatively conservative estimates of climate change impacts. Such feedbacks include: water vapour; cloud cover; snow cover; and sea ice extent; and are considered to modify the effects of increasing temperatures on short timescales.

However, Hansen and others argue that slow feedbacks must also be considered, which greatly increase the potential impacts. They include: ice sheet growth and decay; changes in vegetation cover; permafrost melting; and carbon-cycle feedbacks. [18]

In relation to the IPCC’s reports, Australia’s Chief Climate Commissioner, Professor Tim Flannery, has stated that they are “painfully conservative” because the IPPC “works by consensus and includes government representatives from the United States, China and Saudi Arabia, all of whom must assent to every word of every finding.” [19]

Writing in the Scientific American in 2008, Michael D Lemonick commented as follows on the issue (with my underline): [20]

“The problem is that conventional projections for how warm things will get come out of a calculation everyone knows is wrong. Called the Charney sensitivity, it estimates how much the global mean temperature will rise if atmospheric CO2 is doubled from its preindustrial levels, before people began burning coal and oil on a grand scale”

 “The calculation does take into account some feedback mechanisms that can modify the effects of increasing temperatures on short timescales – changes in water vapor, clouds and sea ice, for example. But for the sake of simplicity, it assumes no change in other, longer-term factors, including changes in glaciation and vegetation; in particulates, such as dust; and in the ability of the ocean to absorb carbon dioxide, which diminishes as sea temperature rises.”

Many, and possibly all, of the fast and slow feedbacks are interrelated.

Examples of feedbacks and potential tipping points

Reduction in area and volume of Arctic sea ice

Sea ice is defined as “Any form of ice found at sea which has originated from the freezing of sea water” [21] It is floating, rather than fixed to land. As described in “Scientific American”, “As ice retreats in a warming world, more dark surface is exposed to absorb solar radiation, which makes the world even warmer, melting more ice.” [22] Atmospheric or ocean warming leads to a loss of sea ice, which in turn causes more warming, then more melting, more warming and so on. For a time, the melting ice may reduce the surrounding ocean temperature, partly offsetting the impact of increased absorption of solar radiation. However, the effect is relatively short-lived, and the higher melting rate soon returns.

That process may be exemplified by the dramatic reduction in Arctic summer sea ice in 2007. In that and the previous year combined, the area of sea ice declined by 22 per cent, compared to an average reduction of 7 per cent per decade between 1979 and 2005. [23] The situation improved over the next three years, but in 2011 the area of sea ice again reduced dramatically. [24]

A key factor in the melting of Arctic sea ice and polar ice caps (refer below) is the non-uniformity of temperature changes. The temperature changes at the poles are around double the global average and about three times the change at the equator. [25]

According to David Spratt:

“ . . . average temperatures in Siberia, Alaska and western Canada are now 3ºC to 4ºC warmer than 50 years ago.”
[26]

“The danger is that an ice-free state in the Arctic summer will kick the climate system into run-on warming and create an aberrant new climate state many, many degrees hotter. The Arctic sea-ice is the first domino and it is falling fast. Other dominos will inevitably fall unless we stop emitting greenhouse gases and cool the planet to get the Arctic sea-ice back. Those dominoes include the Greenland ice sheet.”
[27]

Disintegration of Greenland and Antarctic ice sheets

The Greenland ice sheet is almost 2,400 kilometres long, 1,100 kilometres across at its widest point and more than 2 kilometres thick. [28] James Hansen has reported that, as recently as the 1990’s, it was neither gaining nor losing mass at a substantial rate. As of 2009 it was losing around 250 cubic kilometres of ice per year in a dynamic wet melting process, while Antarctica was losing around half that amount. “The rate of ice sheet mass loss has doubled during the present decade [commencing in 2000].”

Dr Hansen has also stated, “Sea level is going up at a rate of about 3 centimetres (about 1 and 1/5 inches) per decade. But if ice sheet disintegration continues to double every decade, we will be faced with sea level rise of several meters this century. IPCC has estimated only modest rates of sea level rise this century, much less than one meter. But IPCC treats sea level change basically as a linear process. It is more realistic, I believe, that ice sheet disintegration will be non-linear, which is typical of a system that can collapse.” [29]

Figure 3: Greenland’s ice sheet’s diminishing reflectiveness

Greenland_Albedo465

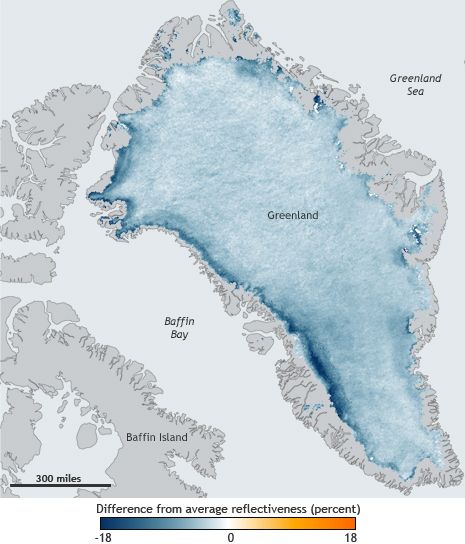
The National Oceanic and Atmospheric Administration (NOAA) reported in December 2011 that in the past decade, satellite observations show a drop in Greenland’s reflectiveness. The darker surface absorbs more sunlight, accelerating melting. They have stated, “The map above shows the difference between the percent of sunlight Greenland reflected in the summer of 2011 and the average percent it reflected between 2000 and 2006. Virtually the entire ice sheet is colored in shades of blue, indicating that the ice sheet reflected as much as 20% less light this summer than it did in the early part of the last decade.” [30]

British glaciologists have recorded water pouring down one of hundreds (possibly thousands) of moulins (craters) on Greenland’s ice cap at an estimated rate of 42 million litres per day. It was reported that Greenland is losing enough water each year to cover Germany to a depth of one metre. [31]

Melting Permafrost

Permafrost is frozen soil (once considered to be permanently frozen), tens of metres deep. It covers twenty per cent of the world’s land mass, with half of it being in Siberia. [32]

The permafrost extends from the mainland into the seabed of the relatively shallow sea of the East Siberian Arctic Shelf. It stores massive amounts of carbon, which can be released in the form of carbon dioxide and methane as the permafrost melts. The IPCC estimates that methane is 72 times more potent than carbon dioxide as a greenhouse gas over a 20 year period. [See Footnote 3 for a more recent estimate.]

David Spratt has reported as follows (with my underlines): [33]

  • The rapid regional warming consequent to the sea-ice loss also has grave repercussions for the permafrost.
  • The National Centre for Atmospheric Research in Boulder predicts that half of the permafrost in the Arctic north will thaw to a depth of 3 metres by 2050.
  • Glaciologist Ted Scambos says, ‘That’s a serious runaway … a catastrophe lies buried under the permafrost.’
  • Permafrost specialist Sergei Zimov says: ‘Permafrost areas hold 500 billion tonnes of carbon, which can fast turn into greenhouse gases … If you don’t stop emissions of greenhouse gases into the atmosphere … the Kyoto Protocol will seem like childish prattle.’
  • The western Siberian peat bog is amongst the fastest-warming places on the planet, and Sergei Kirpotin of Tomsk State University calls the melting of frozen bogs an ‘ecological landslide that is probably irreversible’.
  • In August 2008, Örjan Gustafsson, the Swedish leader of the International Siberian Shelf Study confirmed that methane was now also bubbling through seawater from permafrost on the seabed.
  • So the question is no longer whether the permafrost will start to melt, but if and when the time-bomb will go off. When it does, it will sweep the climate system away from our capacity to stop further dramatic ‘tipping points’ being passed.
  • All the carbon in the permafrost is equivalent to twice the total amount of all carbon dioxide in the atmosphere, so losing even a significant portion of it will create a very different planet from the one we know.
  • Scientists are warning that the temperature at which it will be triggered is closer that think. Research published in mid-2008 by Dmitry Khvorostyanov shows the trigger is warming in the Arctic of around 9ºC, and that once initiated it will maintain itself, leading to three-quarters of the carbon being released within a century. It could happen as early as mid-century. [Footnote 4]

In The Independent of 13 December, 2011, Steve Connor reported as follows in relation to methane being released from permafrost in the seabed of the East Siberian Arctic Shelf (with my underlines): [34]

  • Dramatic and unprecedented plumes of methane . . . have been seen bubbling to the surface of the Arctic Ocean by scientists undertaking an extensive survey of the region.
  • The scale and volume of the methane release has astonished the head of the Russian research team who has been surveying the seabed of the east Siberian Arctic Shelf off northern Russia for nearly 20 years.
  • Igor Semiletov of the International Arctic Research Centre at the University of Alaska Fairbanks . . . said that he has never before witnessed the scale and force of the methane being released from beneath the Arctic seabed.
  • He said, “We carried out checks at about 115 stationary points and discovered methane fields of a fantastic scale – I think on a scale not seen before. Some of the plumes were a kilometre or more wide and the emissions went directly into the atmosphere – the concentration was a hundred times higher than normal.”

Activation of methane hydrates/clathrates

The potential activation of methane hydrates or clathrates sitting below sediment on the ocean floor represents a similar threat to that of carbon stored in permafrost. Clathrates are frozen water molecules containing frozen methane or carbon dioxide molecules. Warming oceans can potentially cause those ice crystals to thaw and release the carbon dioxide and methane.

How much methane is stored as clathrates on the ocean floor?

Speaking on ABC Radio National’s Ockham’s Razor program on 24 May, 2009 [35], Melbourne-based computer programmer Geoff Hudson cited a report by Bruce Buffet and David Archer of the University of Chicago’s Department of Geophysical Sciences [36], in which they estimated the stores of methane to weigh 3,000 billion tonnes. That is six times the weight of carbon estimated to be stored in permafrost, as referred to above.

Hudson reported, “releasing all that methane would be like raising the carbon dioxide level to 70,000 parts per million, more than 100 times worse than the 540 ppm said to the point of no return.” 

Hudson nominated a slowing in the flow of the Gulf Stream as a potential trigger for what is known as the “Clathrate Gun”, involving a process of amplifying feedbacks resulting from some initial thawing of methane clathrates. The Gulf Stream is the massive flow of warm water from the Gulf of Mexico to the North Atlantic. [Footnote 5]

If the flow were to slow sufficiently, there would be excess warm water remaining in the Gulf of Mexico, potentially thawing clathrates that exist on the sea floor there. He stated:

“Once the temperature gets too high, the ices melt. That will release hundreds of cubic kilometres of methane presently sitting on the floor of the Gulf. The trigger for the Clathrate Gun might be just south of New Orleans.”

Hudson noted that Dr Bill Turrell of the Marine Laboratory in Aberdeen, Scotland observed a 20% slowing in the flow of the Gulf Stream five years prior to the Ockham’s Razor broadcast.

As an important aside, with the impact of warming oceans on storm activity, he noted, “Armed with this information, the origin of the strength of Hurricane Katrina is obvious.”

The need for emergency action

With climate feedbacks seemingly leading to exponential growth in greenhouse gas concentrations, it is essential that key decision makers treat the issue as the emergency that it is. We need to urgently transform our energy systems to be emissions free, draw down existing atmospheric carbon dioxide through massive levels of reforestation, and reduce emissions of non-carbon dioxide climate forcing agents, such as methane, nitrous oxide, tropospheric ozone and black carbon. Those issues will be referred to in future articles.

In recent years, governments have spent trillions of dollars to save financial institutions and struggling economies. During World War 2, military expenditures as a percentage of GDP in the US, UK, Germany and Japan were as high as 42%, 55%, 70% and 76% respectively. [37] However, governments are yet to tackle climate change in a meaningful way. Emission reduction targets such as Australia’s figure of 5% are miniscule relative to what is required.

In his article “As emission rise, we may be heading for an ice-free planet”, earth and paleoclimate scientist at Australian National University, Dr Andrew Glikson, stated as follows (with my underline): [38]

“Contrarian claims by sceptics, misrepresenting direct observations in nature and ignoring the laws of physics, have been adopted by neo-conservative political parties. A corporate media maintains a ‘balance’ between facts and fiction. The best that governments seem to do is devise cosmetic solutions, or promise further discussions, while time is running out. 

Good planets are hard to come by.”

A final word from James Hansen on tipping points

“Animal and plant species are already being stressed by climate change. Species can migrate in response to movement of their climatic zone, but some species in polar and alpine regions will be pushed off the planet. As climate zones move farther and faster, climate change will become the primary cause of species extinction. The tipping point for life on the planet will occur when so many interdependent species are lost that ecosystems collapse.” [39]

Footnotes

  1. Dr Hansen has since retired from NASA’s Goddard Institute for Space Studies so as to more freely campaign on climate change.
  2. In 2014, Barry Brook became Professor of Environmental Sustainability at the University of Tasmania.
  3. The emissions of different gases can be aggregated by converting them to carbon dioxide equivalents (CO2-e).  They are converted by multiplying the mass of emissions by the appropriate global warming potentials (GWPs).  GWPs represent the relative warming effect of a unit mass of the gas when compared with the same mass of CO2 over a specific period.  For methane, at the date of this republication, the GWPs used by the UN’s Intergovernmental Panel on Climate Change (IPCC), allowing for climate-carbon feedbacks, are 34 for 100 years and 86 for 20 years.
  4. Temperature increases at the poles to date have been multiples of the global average.
  5. Hudson’s estimate is significantly higher than potential impact of carbon released from permafrost, as referred to earlier in this article. The reason may be the application of: (a) methane’s GWP (referred to in Footnote 3); and (b) differences between atmospheric and sea level pressures; in his calculations.

Author

Paul Mahony

References

[1]     Painting, R., “The Oceans Warmed up Sharply in 2013: We’re Going to Need a Bigger Graph”, Skeptical Science, 31 January 2014, http://www.skepticalscience.com/The-Oceans-Warmed-up-Sharply-in-2013-We-are-Going-to-Need-a-Bigger-Graph.html

[2]       Skeptical Science, “Global Warming at 4 Hiroshima Atomic Bombs per Second”, https://4hiroshimas.com/

[3]       Miller, C., quoted at NASA, “Global Climate Change: Vital Signs for the Planet”, http://climate.nasa.gov/400ppmquotes/

[4]       Mann, M.E., “Earth Will Cross the Climate Danger Threshold by 2036”, Scientific American, 18th March, 2014, http://www.scientificamerican.com/article/earth-will-cross-the-climate-danger-threshold-by-2036/, cited in Spratt, D., “Two degrees of warming closer than you may think”, Climate Code Red, 6th February, 2015, http://www.climatecodered.org/2015/02/two-degrees-of-warming-closer-than-you.html#more

[5]       Spratt, D. and Dunlop, I., “Dangerous Climate Warming: Myth, reality and risk management”, Oct 2014, p. 5, http://www.climatecodered.org/p/myth-and-reality.html

[6]       Spratt, D., “Two degrees of warming closer than you may think”, Climate Code Red, 6th February, 2015, http://www.climatecodered.org/2015/02/two-degrees-of-warming-closer-than-you.html#more

[7]       Scripps Institution of Oceanography, National Oceanic and Atmospheric Administration (NOAA) Monthly Data for the Atmospheric CO2 Since 1958, via http://co2now.org/Current-CO2/CO2-Trend/ (Accessed 4 February 2012)

[8]       Data is calculated by CO2Now using annual growth rates published by NOAA-ESRL based on its measurements of the CO2 concentration in the atmosphere (Mauna Loa Observatory).  Refer to http://co2now.org/Current-CO2/CO2-Trend/ (Accessed 4 February 2012)

[9]       Spratt, D.,“Global Warming – No more business as usual: This is an emergency!”, Environmental Activists’ Conference 2008: Climate Emergency – No More Business as Usual, 10 October, 2008, reproduced in Links International Journal of Socialist Renewal, http://links.org.au/node/683 (Accessed 4 February 2012)

[10]      Hansen, J, “Storms of my Grandchildren”, Bloomsbury, 2009, p. IX

[11]     Sound system image courtesy of TOA Corporation, http://www.toa.jp/soundoh_wiki/index.php?Soundindex%2FAcoustic%20feedback

[12]      CSIRO, “Science and Solutions for Australia: Climate Change”, 2011, Extract of Fig. 2.3, p. 22, http://www.csiro.au/Outcomes/Climate/Climate-Change-Book.aspx

[13]      Hansen, J, op cit.

[14]      CSIRO, op cit., p. 15

[15]      Whetton, P, “Future Australian Climate Scenarios”, Chapter 3, p. 43 “Climate Change”, CSIRO Publishing, 2011, Cleugh, H; Stafford Smith, M; Battaglia, M; Graham, P (Editors), http://www.publish.csiro.au/Books/download.cfm?ID=6558 (Accessed 4 February 2012)

[16]      Vale, P,“Climate Change: World Reaches Point Of No Return In Five Years, Say Scientists”, The Huffington Post UK, 9 Nov, 2011, http://www.huffingtonpost.co.uk/2011/11/09/climate-change-five-years_n_1084052.html (Accessed 4 February 2012)

[17]      Spratt, D, 2008, op cit.

[18]      Spratt, D and Sutton, P, “Climate Code Red: The case for emergency action”, Scribe, 2008, p. 47

[19]      Spratt, D, 2008, op cit.

[20]      Lemonick, Michael D, “Beyond the Tipping Point”, Scientific American Earth 3.0, 6 October 2008, http://www.scientificamerican.com/article.cfm?id=global-warming-beyond-the-co2 <http://www.scientificamerican.com/article.cfm?id=global-warming-beyond-the-co2>  (Preview) (Full article accessed 4 February 2012)

[21]      Data Buoy Cooperation Panel, http://www.dbcp.noaa.gov/seashelp/HtmlIceGlossary.htm (Accessed 4 February 2012)

[22]      Lemonick, Michael D, op cit.

[23]      Spratt, D and Sutton, P, op cit., p. 13

[24]      Raloff, J., “Science News of the Year 2011 – Environment”, Science News, 31 December 2011, Vol. 180 Issue 14, p 25, http://www.sciencenews.org/view/feature/id/336997/title/2011_Science_News_of_the_Year_Environment

[25]      Hansen, J., op cit., p. 38.

[26]      Spratt, D and Lawson, D, “Bubbling our way to the Apocalypse”, Rolling Stone, November 2008, pp. 53-55 and republished on the Climate Code Red website, 4th September 2010

[27]      Spratt, D. 2008, op cit.

[28]      Spratt, D and Sutton, P, op cit., p. 20.

[29]      Hansen, J., op cit., pp. 255-256 and p. 287. (An alternative ice loss figure to the quoted figure of 250 cubic km from p. 287 had been shown on p. 255 but the correct figure has been confirmed as 250 cubic km in emails of 15/6/11 and 16/6/11.)

[30]      Lyndsey, R, “Greenland Ice Sheet Getting Darker”, Climate Watch Magazine, NOAA Climate Services, 30 December 2011, http://www.climatewatch.noaa.gov/article/2011/greenland-ice-sheet-getting-darker-2 (including map) (Accessed 4 February 2012)

[31]      Salter, J. “Scientists capture dramatic footage of Arctic glaciers melting in hours”, The Telegraph, 20 February 2009, http://www.telegraph.co.uk/earth/environment/climatechange/4734859/Scientists-capture-dramatic-footage-of-Arctic-glaciers-melting-in-hours.html (Accessed 4 February 2012)

[32]      Spratt, D and Lawson, D, op cit.

[33]      Spratt, D, 2008, op cit.

[34]      Connor, S, “Vast methane ‘plumes’ seen in Arctic ocean as sea ice retreats”, The Independent, 13 December, 2011, http://www.independent.co.uk/news/science/vast-methane-plumes-seen-in-arctic-ocean-as-sea-ice-retreats-6276278.html (Accessed 4 February 2012)

[35]      Hudson, G, “The trigger for the clathrate gun” Ockham’s Razor, ABC Radio National, 24 May, 2009, http://www.abc.net.au/radionational/programs/ockhamsrazor/the-trigger-for-the-clathrate-gun/3152002 (Accessed 4 February 2012)

[36]      Buffet, B and Archer, D, “Global inventory of methane clathrate: sensitivity to changes in the deep ocean”, Earth and Planetary Science Letters 227 (2004) 185 – 199, http://geosci.uchicago.edu/~archer/reprints/buffett.2004.clathrates.pdf (Accessed 4 February 2012)

[37]      Spratt, D and Sutton, P, op cit., p. 252

[38]      Glikson, A, “As emissions rise, we may be heading for an ice-free planet”, The Conversation, 18 January, 2012, http://theconversation.edu.au/as-emissions-rise-we-may-be-heading-for-an-ice-free-planet-4893 (Accessed 4 February 2012)

[39]      Hansen, J, “Twenty Years Later: Tipping Points Near on Global Warming”, Huffington Post, 23/6/08, http://www.huffingtonpost.com/dr-james-hansen/twenty-years-later-tippin_b_108766.html (Accessed 4 February 2012)

Images

Feature image: Harvepino, “Greenland and Iceland from Earth’s orbit in space. 3D illustration with detailed planet surface. Elements of this image furnished by NASA”, Shutterstock

Ocean heat image in Foreword: See reference 2

Figure 1: See reference 7

Figure 2: See references 11 & 12

Figure 3: Map by NOAA’s climate.gov team, based on NASA satellite data processed by Jason Box, Byrd Polar Research Center, the Ohio State University, from Lindsey, R., “Greenland Ice Sheet Getting Darker“, op. cit.

Cowspiracy

I’ve written about the Australian red meat industry’s response to the documentary film Cowspiracy in two previous posts. This post consolidates the key points and provides some new perspectives.

Who’s representing the industry?

The industry’s arguments appear on its Target 100 website, which has been established by five organisations: Meat & Livestock Australia; Australian Lot Feeders Association; Australian Meat Industry Council; Sheep Meat Council of Australia; and Cattle Council of Australia. [1]

Based on that level of representation, it seems that the industry is keen to defend itself against the movie’s claims.

Seventeen arguments become twelve

In its website posts of October and November, 2014, the industry put forward seventeen arguments to support its position. Some of those arguments, relating to research activities and methane, were effectively repeated many times. By my reckoning, the result is that only twelve distinct arguments were presented. I’ll consider them all in this post, with some repetition from my previous posts. [Footnote 1].

The industry has shot itself in the foot

With four of the twelve arguments, the industry has figuratively shot itself in the foot.

Shot in the foot #1: Dr Barry Traill

At the time of writing, the industry is claiming on its website that the director of The Pew Charitable TrustsOutback Australia program, Dr Barry Traill (mis-spelt “Trail” on the website), argues that using arid land for cattle grazing may be positive in Australia. The evidence they cite is Dr Traill’s TEDx presentation of May, 2014, Populate wilderness or perish“.

A key point of the presentation was that we need more people in the Outback than at present, in order to appropriately manage issues such as fire regimes and feral animals. [Footnote 2]

Dr Traill’s comment on the cattle industry occupied just 5 seconds of that 10 minute 48 second presentation. He said (at 9:05), “Many cattle station owners are doing a great job of managing their part of the outback”.

But do the words “doing a great job” mean livestock grazing? He may have meant that many pastoralists are reducing livestock numbers and diversifying into other activities with clear environmental benefits.

Dr Traill co-authored Pew’s October, 2014 publication, The Modern Outback: Nature, people, and the future of remote Australia“. [2] The authors have commented extensively on the destructive environmental impacts of grazing. Problems include tree clearing, introduction of invasive pasture grasses, degradation of land and natural water sources, and manipulation of fire regimes (p. 167-171).

The authors highlighted the fact that the environment improves when pastoralists move away from intense grazing activity.  In one example, the pastoralists “are closely monitoring the gradual regrowth of grazing-sensitive plants.” They “host Outback farm stays and tours to diversify their income and raise awareness about the importance of giving pastoral land time to recover from over a century of intense grazing.” (p. 170)

In his TEDx presentation and elsewhere, Dr Traill has emphasised the fact that the number of Aboriginals in remote Outback areas has reduced as people have moved into more central settlements and towns. As a result of this trend, some native animal species have either disappeared or greatly declined. [3]

In the report mentioned above, he and his co-authors highlight the need for people to help manage the environment, but their position should not be interpreted as one that promotes the idea of more pastoralists grazing livestock. The report highlights that extensive benefits have been derived through the introduction of indigenous ranger groups and the declaration of indigenous protected areas (IPAs) across huge regions. There are now 67 IPAs covering more than 540,000 square kilometres, which is more than twice the size of the state of Victoria. There are also more than 750 indigenous rangers managing and safeguarding the land.

Pastoral leases for cattle, sheep and goats cover around 40 percent of the Outback, which in turn occupies 73 percent of the 7.7 million square kilometre continent. Between 60 and 70 percent of the continent as a whole is managed through such leases. The Pew Charitable Trust is campaigning for state governments to permit (unlike at present) non-grazing related activities on pastoral land. An example is Western Australia, where the relevant leases (occupying 30 percent of the state’s massive land area) will expire in June 2015. The organisation “recommends making a diversity of options available for pastoral lease lands and ensuring good governance with a focus on sustainable management, population support and economic viability”. [4]

The organisation certainly does not appear to be supporting grazing activity in terms of environmental performance.

Shot in the foot #2: Biodiversity and other environmental impacts

The industry says that greenhouse gas emissions are just one aspect of environmental management. It says that while there is enormous focus on how to reduce methane emissions “this needs to be done with consideration for impacts on other important environmental factors such as  biodiversity”.

I couldn’t agree more!

The Food and Agriculture Organization of the United Nations (FAO) has stated that livestock production “is one of the major causes of the world’s most pressing environmental problems, including global warming, land degradation, air and water pollution, and loss of biodiversity.” [26]

Although the industry is supporting research in relation to issues such as water, soil and ground cover, and biodiversity, much of the research can only assist in finding incremental improvements relative to the benefits that could be derived from a general move away from animal agriculture.

Shot in the foot #3: Grass-fed versus grain-fed animals

The industry seems keen to point out that the extent to which cattle are grain-fed in Australia is lower than in the US.

They don’t seem to recognise that while cows are fed on grass, they produce far more methane than when they are fed on grain.

Australia’s Commonwealth Scientific and Industrial Research Organisation (CSIRO) has estimated that cows fed on grass produce 4 times as much methane as those fed on grain. [5]

In November, 2013, the FAO (Food and Agriculture Organization of the United Nations) reported that the global average emissions intensity (kilograms of greenhouse gas emissions per kilogram of end product) was 81 percent higher in beef derived from animals on “grazing” (or “grass-based”) feeding systems than in those on “mixed” systems. [6] (Cows are not fed grain exclusively. They have not evolved to consume it, and if it is used at all, they are generally only “finished” on it for up to 120 days prior to slaughter.)

Even a study by The University of New South Wales, funded by Meat & Livestock Australia and referred to on the Target 100 website, reported that grass-fed cows produce more methane than others. [8]

Perhaps the industry has overlooked the research it has funded, and believes that the natural way is best in all respects, when clearly it is not.

At least they’re not alone. The Australian Conservation Foundation (ACF) and Bill McKibben of 350.org have made similar claims, with neither citing any evidence for their position. [9] However, the ACF has subsequently removed its comments from the relevant websites.

Shot in the foot #4: Reduction of 5.3% in beef’s emissions intensity in 20 years (and they think that’s good)

The industry claims that the Australian production efficiencies have resulted in a 5.3% reduction in emissions per tonne of beef between 1990 and 2010. Why does that represent a shot in the foot? The industry applauds a 5.3% reduction in 20 years, which equals an annual rate of 0.286% from the reducing balance.

At that rate, it would take 243 years to achieve a 50% reduction from the 1990 level.

Here’s how the current global average emissions intensity of grass-fed beef compares with soy beans and legumes [Footnote 3]:

Figure 1: Emissions intensity (kg CO2-e/kg product) with GWP20

Emissions-intensity-sharpened

If we were to halve the figure for grass-fed beef (perhaps generously assuming Australia’s figure was half the global average), and then halve it again looking ahead 243 years, then the figure for grass-fed beef (72 kg/kg CO2-e) would still be around 20 to  35 times greater than that of legumes and soy beans (using a 20-year timeframe for assessing the global warming potential of relevant greenhouse gases).

In any event, we can’t wait 243 years or more to turn this problem around, particularly when a rapid and dramatic improvement in our food system’s environmental performance could be achieved by simply moving away from animal-based products.

Eight remaining arguments are very weak

I have commented on these arguments elsewhere (see article links below), so will only comment briefly here.

Research

The “Target 100” title refers to one hundred industry initiatives, including research, aimed at improving its environmental performance. However, in terms of global warming, the performance of animal-based and plant-based products are on different paradigms. No amount of research is likely to reduce animal-based emissions to a level that is realistically comparable to that of the plant-based alternatives.

Land clearing

The industry states that it does not buy grain from the Amazon, and that the Australian industry’s emissions from deforestation have reduced dramatically since 2006.

However, we have cleared around 700,000 square kilometres of land in this country for animal agriculture, so we don’t need to look towards South America for staggering levels of environmental destruction. [10] Also, the legislation banning broadscale land clearing (subject to exemptions) was overturned by the Queensland Liberal National Party government in 2013 in respect of land deemed to be of “high agricultural value”. [11]

The recently elected Labor government may review that legislation, but the forests will always be at risk of further clearing, depending largely on the inclination of the government of the day. The recent free trade deal with China is likely to increase pressure for further livestock-related land clearing.

In any event, we must live with the legacy of foregone carbon sequestration, which is not accounted for in any official emissions figures.

Alignment with National Greenhouse Gas Inventory figures

The industry points out that the figures it uses are aligned with those of the Australian Government’s National Greenhouse Inventory.

That’s true, but as I have stated elsewhere, critical under-reporting of livestock’s impact occurs in many “official” figures because relevant factors are omitted entirely, classified under non-livestock headings, or considered but with conservative calculations. [12] Do we want to know what’s really happening so that we can identify necessary mitigation opportunities, or do we want it masked in this way?

Life Cycle Assessment Study

The life cycle assessment study cited and funded by the industry did not appear to include land clearing and certain other factors often included in such studies. [8] Even without those factors, the results were very poor, with beef’s emissions intensity figures being multiples of plant-based alternatives.

As an alternative, applying a 20-year GWP for relevant gases to the FAO’s average emissions intensity figure for specialised beef in Oceania (which includes Australia) [7], and adjusting for retail weight, would result in a figure of around 100 kg CO2-e/kg of product. The figure for grass fed beef in isolation would be significantly higher.

Grain grown solely for animals?

The industry claims that cattle are not consuming grains that humans can eat, and are therefore not depriving those who are undernourished of food.

The resources (including land) used to grow grain for cattle have many possible alternative uses, including food production for humans or regeneration of natural habitat, helping to draw down existing atmospheric carbon as a critical climate change mitigation measure. Utilising those resources to provide food for livestock in a grossly and inherently inefficient system is unnecessary, unjust, and incredibly damaging to the environment.

Livestock’s Long Shadow discrepancies

The industry has referred to some recognised discrepancies in the methodologies utilised by the FAO in its 2006 “Livestock’s Long Shadow” report. Regardless of those concerns, the FAO’s latest estimate of livestock’s contribution to global warming (14.5%) is significant, despite being extremely conservative. Regardless of the percentage arrived at, we are unlikely to overcome climate change without a general transition toward plant-based products. [13]

Great Barrier Reef

The industry says it accepts its role in seeking to improve the health of the Great Barrier Reef. Yet the 2012-13 report card of the Reef Water Quality Protection Plan (released in 2014) indicated that only 30 percent of graziers had adopted improved land management practices since the plan commenced in 2009. [14]

The 2013 Scientific Consensus Statement highlighted the livestock sector’s major role in destruction from pollution, primarily in relation to suspended solids (sediment), nitrogen and phosphorus. [15] The release of nitrogen and phosphorus, and the associated nutrient enrichment, contributes significantly to outbreaks of Crown of Thorn starfish, which have had a massive impact on the reef. [16]

World Wildlife Fund

The industry argues that “Cowspiracy” is incorrect in suggesting that no environmental groups are looking into the beef industry due to its political power. It refers to the World Wildlife Fund’s involvement in the Global Roundtable for Sustainable Beef.

I argue that a transformational change of diet is required, rather than a search for “sustainable beef”, which is a term I regard as an oxymoron in the context of our current environmental emergencies, including climate change.

Of interest may be the fact that the World Wildlife Fund (WWF) has been accused of working with major business organisations that allegedly use the WWF brand to help improve their green credentials, while acting against the interests of the environment. [17]

What is methane?

The industry has also created a page headed “What is methane?“, which has (at the time of writing) some serious and not so serious shortcomings. [18]

Firstly, it says that methane is 25 times as potent as carbon dioxide as a greenhouse gas. That figure is out of date. The IPCC (Intergovernmental Panel on Climate Change) used a figure of 25 in 2007 but increased it to 34 (with climate carbon feedbacks) in its 2013 Fifth Assessment Report. [19]

Secondly, the figure is based on a 100-year time horizon. A 20-year time horizon may be more appropriate when considering methane’s emissions due to the relatively rapid breakdown of the gas in the atmosphere.  On that basis, the IPCC reports that methane is 86 times as potent as carbon dioxide (with climate carbon feedbacks).

The IPCC says, “There is no scientific argument for selecting 100 years compared with other choices. The choice of time horizon is a value judgement because it depends on the relative weight assigned to effects at different times.” [20] (NASA estimates the multiple to be 105 when allowing for direct and indirect radiative effects of aerosol responses.) [21]

Thirdly, the page refers to the “International” Panel on Climate Change, when the correct term is “Intergovernmental”, as referred to above.

Finally, the industry indicates that methane levels in the atmosphere have remained stable since 2000 “despite significant increases in livestock numbers globally”.  If only it were true. This is what’s happened to methane emissions according to the US National Oceanic and Atmospheric Administration: [22]

Figure 2: Atmospheric Methane Concentrations (NOAA ESRL)

aggi.fig2-methane

Conclusion

The red meat industry can argue forever about the supposed environmental credentials of its products. However, we face a crisis in the form of climate change and other environmental issues. Those without a vested interest need to face the reality of that crisis, and fight for urgent action.

It is pleasing that the United States Dietary Guidelines Advisory Committee has recently recommended a reduction in meat consumption for environmental and health reasons. [23] That development may add to the general awareness that appears to be developing in respect of climate change, including animal agriculture’s adverse impacts.

Author: 

Paul Mahony (also on Twitter, Scribd, Slideshare and Viva la Vegan)

Footnotes:

1. In assessing the industry’s various arguments, I have categorised two concerning grass-fed cows as methane arguments, due to the fact that grass-feeding is a key factor in that regard.

2. Dr Traill has said that there have been two reasons for the decline in native animal species as Aboriginal people left remote areas. The first is fire. “Drier areas were burnt in particular ways by Aboriginal people. The usual pattern was to have smaller spot fires in different seasons to create a patchwork of vegetation of various ages. This mosaic approach provides the right habitat mix for different animals, particularly some mammals.”  He points out that without people to manage the burning, most outback fires are larger and fiercer than they were previously. For example, in the western desert country of the Martu people, the average area of a single fire has increased from 64 hectares to 52,000 hectares. The second reason is invasive plant and animal species, including feral cats, rabbits, cane toads, water buffalo, goats, camels, pigs, donkeys, horses, cattle and noxious foreign weeds including various types of pasture grasses. He says: “To stay healthy, even our most remote landscapes need regular care and maintenance.”

3. For grass-fed beef, the FAO has reported a global average emissions intensity figure of 102.2 kg CO2-e/kg of product. The reference period is 2005. [24]

That figure was based on carcass weight. If we gross it up to allow for the fact that not all the carcass is used as end product for the dinner table, the figure increases to 140.2. That’s based on the US Department of Agriculture’s mid-range yield estimate of 72.8% for beef. [25]

When we then adjust the figure to allow for a 20-year global warming potential for methane (86 compared to 25) and nitrous oxide (268 compared to 298), it increases to 287. (The figure of 287 is slightly lower than a previous estimate (291) due to the adjustment of nitrous oxide’s GWP.)

The figure of 287 attributes all carcass weight emissions to retail cuts of meat. If emissions are also attributed to other products that may be derived from the carcass, utilising fat, bone and the like, then the emissions intensity of the retail cuts will be lower than shown here, at around 209 kg CO2-e/kg product.

The figures are based on the breakdown by the FAO of the different greenhouse gases contributing to beef’s emissions intensity (CO2 26.9%; CH4 44.0%; N2O 29.1%). As each of those percentages represents the average between grazing and mixed systems, the figures for grass-fed beef may be understated. That’s because methane’s share of emissions in a grazing system would be higher than in a mixed system, and the methane figure is grossed up considerably when adjusting for a 20 year global warming potential. The emissions intensity figures vary significantly by region.

The figures for soy beans and legumes are from a 2014 study by Oxford University researchers (Scarborough, et al.). [26]

Updates:

  • Additional comments added to Footnote 3 regarding the FAO’s reference period and methane’s share of emissions. (22nd Feb, 2015)
  • Figures in item #4 amended to reflect a reduction of 5.3% in emissions intensity over a period of 20 years, rather than 24 years. (Although the industry’s comments were published in 2014, they reflect 2010 production figures.) (22nd Feb, 2015)
  • Comments added in relation to the life cycle assessment study. (25th Feb, 2015)
  • Comments regarding retail cuts of meat added to Footnote 3 on 4th April, 2015.

Author: 

Paul Mahony (also on Twitter, Scribd, Slideshare and Viva la Vegan)

Main Image: From Cowspiracy: the sustainability secret, http://www.cowspiracy.com/. Used with permission.

Related articles:

Cowspiracy and the Australian red meat industry (9th Nov, 2014)

More on Cowspiracy and the Australian red meat industry (6th Dec, 2014)

Livestock and climate: Do percentages matter? (15th Nov, 2014)

References:

[1] Meat & Livestock Australia; Australian Lot Feeders Association; Australian Meat Industry Council; Sheep Meat Council of Australia; and Cattle Council of Australia, “Target 100: Cowspiracy”, 28th October and 24th November, 2014, http://www.target100.com.au/Hungry-for-Info/Target-100-Responds/Cowspiracy (accessed 21st February, 2015)

[2] Woinarski, J., Traill, B., Booth, C., “The Modern Outback: Nature, people, and the future of remote Australia”, The Pew Charitable Trusts, October 2014, http://www.pewtrusts.org/en/research-and-analysis/reports/2014/10/the-modern-outback

[3] Traill, B., “Populate or perish”, The Pew Charitable Trusts Outback Program, Opinion, 12th January, 2015, http://www.pewtrusts.org/en/about/news-room/opinion/2015/01/12/populate-or-perish

[4] “Pastoral lease reform: Opportunity knocks for Western Australia”, The Pew Charitable Trusts News, 27th October, 2014, http://www.pewtrusts.org/en/about/news-room/news/2014/10/27/pastoral-lease-reform-for-western-australia

[5] Harper, L.A., Denmead, O.T., Freney, J.R., and Byers, F.M., Journal of Animal Science, June, 1999, “Direct measurements of methane emissions from grazing and feedlot cattle”, J ANIM SCI, 1999, 77:1392-1401, http://www.ncbi.nlm.nih.gov/pubmed/10375217; http://www.journalofanimalscience.org/content/77/6/1392.full.pdf

[6] Food and Agriculture Organization of the United Nations, “Tackling climate change through livestock: A global assessment of  emissions and mitigation opportunities”, Nov 2013, Table 5, p. 24, http://www.fao.org/ag/againfo/resources/en/publications/tackling_climate_change/index.htm; http://www.fao.org/docrep/018/i3437e/i3437e.pdf

[7] Food and Agriculture Organization of the United Nations, “Greenhouse gas emissions from ruminant supply chains: A global life cycle assessment”, Nov 2013, Fig. 12, p. 30, http://www.fao.org/ag/againfo/resources/en/publications/tackling_climate_change/index.htm; http://www.fao.org/docrep/018/i3461e/i3461e.pdf

[8] Peters, G.M., Rowley, H.V., Wiedemann, S., Tucker, R., Short, M.D., Schultz, M., “Red Meat Production in Australia: Life Cycle Assessment and Comparison with Overseas Studies”, Environ. Sci. Technol., 2010, 44 (4), pp 1327–1332, DOI: 10.1021/es901131e, online January 12, 2010, http://pubs.acs.org/doi/abs/10.1021/es901131e

[9] Mahony, P. “Do the math: There are too many cows!”, Terrastendo, 26th July, 2013, https://terrastendo.net/2013/07/26/do-the-math-there-are-too-many-cows/

[10] Derived from Russell, G. “The global food system and climate change – Part 1”, 9 Oct 2008, http://www.bravenewclimate.com, which utilised: Dept. of Sustainability, Environment, Water, Population and Communities, State of the Environment Report 2006, Indicator: LD-01 The proportion and area of native vegetation and changes over time, March 2009; and ABS, 4613.0 “Australia’s Environment: Issues and Trends”, Jan 2010; and ABS 1301.0 Australian Year Book 2008, since updated for 2009-10, 16.13 Area of crops.

[11] Roberts, G, “Campbell Newman’s LNP bulldozing pre-election promise”, The Australian, 1 June, 2013, http://www.theaustralian.com.au/national-affairs/campbell-newmans-lnp-bulldozing-pre-election-promise/story-fn59niix-1226654740183; http://sunshinecoastbirds.blogspot.com.au/2013/06/campbell-newman-takes-axe-to-queensland.html

[12] Mahony, P., Omissions of Emissions: A Critical Climate Change Issue, Terrastendo, 9th February, 2013, https://terrastendo.net/2013/02/09/omissions-of-emissions-a-critical-climate-change-issue/

[13] Mahony, P. “Livestock and climate change: Do percentages matter?”, Terrastendo, 15th November, 2014, https://terrastendo.net/2014/11/15/livestock-and-climate-do-percentages-matter/

[14] Kroon, F., Turner, R., Smith, R., Warne, M., Hunter, H., Bartley, R., Wilkinson, S., Lewis, S., Waters, D., Caroll, C., 2013 “Scientific Consensus Statement: Sources of sediment, nutrients, pesticides and other pollutants in the Great Barrier Reef Catchment”, Ch. 4, p. 12, The State of Queensland, Reef Water Quality Protection Plan Secretariat, July, 2013, http://www.reefplan.qld.gov.au/about/scientific-consensus-statement/sources-of-pollutants.aspx

[15] Reef Water Quality Protection Plan, “Report Card 2012 and 2013″, June 2014, http://www.reefplan.qld.gov.au/measuring-success/report-cards/2012-2013-report-card.aspx

[16] Brodie, J., “Great Barrier Reef dying beneath its crown of thorns”, The Conversation, 16th April, 2012, http://theconversation.com/great-barrier-reef-dying-beneath-its-crown-of-thorns-6383

[17] Vidal, J., “WWF International accused of ‘selling its soul’ to corporations”, The Guardian, 4th October, 2014, http://www.theguardian.com/environment/2014/oct/04/wwf-international-selling-its-soul-corporations

[18] Meat & Livestock Australia; Australian Lot Feeders Association; Australian Meat Industry Council; Sheep Meat Council of Australia; and Cattle Council of Australia, “Target 100: What is methane?” (accessed 21st February, 2015), http://www.target100.com.au/Environment/Emissions/What-is-methane

[19] Myhre, G., D. Shindell, F.-M. Bréon, W. Collins, J. Fuglestvedt, J. Huang, D. Koch, J.-F. Lamarque, D. Lee, B. Mendoza, T. Nakajima, A. Robock, G. Stephens, T. Takemura and H. Zhang, 2013: “Anthropogenic and Natural Radiative Forcing. In: Climate Change 2013: The Physical Science Basis. Contribution of Working Group 1 to the Fifth Assessment Report of the Intergovernmental Panel on Climate Change” , Table 8.7, p. 714 [Stocker, T.F., D. Qin, G.-K. Plattner, M. Tignor, S.K. Allen, J. Boschung, A. Nauels, Y. Xia, V. Bex and P.M. Midgley (eds.)]. Cambridge University Press, Cambridge, United Kingdom and New York, NY, USA, http://www.ipcc.ch/report/ar5/wg1/

[20] ibid., pp. 711-712.

[21] Shindell, D.T., Faluvegi, G., Koch, D.M., Schmidt, G.A., Unger, N., Bauer, S.E., Improved Attribution of Climate Forcing to Emissions“, Science 30 October 2009: Vol. 326 no. 5953 pp. 716-718 DOI: 10.1126/science.1174760, https://www.sciencemag.org/content/326/5953/716.figures-only

[22] NOAA Earth System Research Laboratory, “The NOAA Annual Greenhouse Gas Index (AGGI)”, Summer 2014, http://www.esrl.noaa.gov/gmd/aggi/aggi.html

[23] Rothkopf, J., “Major dietary guidelines report recommends decreasing meat consumption”, Salon.com, 20th February, 2015, http://www.salon.com/2015/02/19/major_dietary_guidelines_report_recommends_decreasing_meat_consumption/

[24] Food and Agriculture Organization of the United Nations, “Tackling climate change through livestock: A global assessment of emissions and mitigation opportunities”, Nov 2013, extract of Fig. 7, p. 24 (Meat), http://www.fao.org/ag/againfo/resources/en/publications/tackling_climate_change/index.htm

[25] United States Department of Agriculture Economic Research Service, Agricultural Handbook No. 697, June, 1992 (website updated 10 September, 2013), “Weights, Measures, and Conversion
Factors for Agricultural Commodities and Their Products”, Table 11. p. 21,
http://www.ers.usda.gov/publications/ah-agricultural-handbook/ah697.aspx#.U0ihR6Ikykw

[26] Scarborough, P., Appleby, P.N., Mizdrak, A., Briggs, A.D.M., Travis, R.C., Bradbury, K.E., & Key, T.J., “Dietary greenhouse gas emissions of meat-eaters, fish-eaters, vegetarians and vegans in the UK”, Climatic Change, DOI 10.1007/s10584-014-1169-1, http://link.springer.com/article/10.1007%2Fs10584-014-1169-1

Like me, you might be accustomed to seeing percentage figures on posters and elsewhere, indicating livestock’s share of greenhouse gas emissions.

Here’s an image showing a poster from the People’s Climate March in New York in September, 2014.

51-percent-poster-enhanced

I’m not keen on quoting figures indicating livestock’s climate change impacts, unless I can try to explain them. Posters are not a great way to do that.

One problem is that, while environmental processes are dynamic, the figures are often portrayed as if they’re set in stone.

Another problem is that the figures depend on whichever factors have been taken into account, which can vary significantly from one report to another.

I commented on that issue in my February, 2013 article Omissions of Emissions: A Critical Climate Change Issue“. [1] I stated that critical under-reporting of livestock’s impact occurs  in many “official” figures because relevant factors are omitted entirely, classified under non-livestock headings, or considered but with conservative calculations.

An example of the latter is methane’s impact based on a 100-year, rather than 20-year, global warming potential(GWP). Methane is many times more potent than carbon dioxide as a greenhouse gas, and more so over a 20 year time horizon than 100 years. More on that below.

So while figures are often portrayed as being absolute, they should ideally be qualified so as to explain how they have been arrived at. That might not be very practical, but the issues are complex and cannot always be conveyed appropriately with just a few words or numbers.

Some prominent claims 

Livestock reported to be responsible for 18 percent of emissions (which is more than transport)

In its 2006 “Livestock’s Long Shadow” report, the Food and Agriculture Organization of the United Nations (FAO) stated that livestock’s emissions represented 18 percent of the global total in the 2005 reference period. The figure was said to be higher than transport’s share. [2]

In September 2013, the FAO reduced its estimate of livestock’s share to 14.5 percent, yet that figure seems to have received relatively little attention. [3] As with “Livestock’s Long Shadow”, the reference period was 2005, but the assessment methodology had been amended. [4] The reasoning was that the FAO had used or relied on different methods for assessing the relative emissions of livestock and transport. In other words, they had not compared “apples with apples”. [5]

Despite the amended approach, both the 2006 and 2013 reports included emissions from fertiliser and feed production, land clearing, manure management, enteric fermentation (producing methane in the animal’s digestive system) and transportation of livestock animals and their feed. Both were based on the conservative 100-year GWP for methane.

Livestock reported to be responsible for at least 51 percent of emissions

The suggestion that livestock are responsible for at least 51 percent of the world’s greenhouse gas emissions came from a 2009 World Watch magazine article by Robert Goodland and Jeff Anhang. [6] Goodland was the lead environmental adviser to the World Bank, and Anhang is a research officer and environmental specialist at the World Bank’s International Finance Corporation.

The article was effectively a critique of “Livestock’s Long Shadow”, with amended figures reflecting the authors’ concerns over the report.  The authors took into account various factors, including: livestock respiration; 20-year GWP for livestock-related methane; and some allowance for foregone carbon sequestration on land previously cleared.

1. Livestock respiration

The authors argued that livestock respiration was overwhelming photosynthesis in absorbing carbon due to the massive human-driven increase in livestock numbers and removal of vegetation. Goodland subsequently stated, “In our assessment, reality no longer reflects the old model of the carbon cycle, in which photosynthesis balanced respiration”. [7]

Some have argued against the inclusion of respiration. Based on my calculations, by excluding that factor, the analysis would have indicated that livestock’s emissions represented 43 percent of the global total.

2. Methane

Goodland and Anhang applied a 20-year GWP to livestock-related methane emissions, which is particularly relevant to: (a) potential near-term climate change tipping points; and (b) identification of relatively rapid mitigation measures.

Methane breaks down in the atmosphere relatively quickly, with little remaining after 20 years. As a result, a 100-year GWP greatly understates its shorter-term impact.

Even methane’s near-term impacts can become long-term and irreversible to the extent that they contribute to us reaching tipping points and runaway climate change.

Comments from the IPCC, cited by respected climate change commentator, Joseph Romm, reflect the validity of using a 20-year GWP:

“There is no scientific argument for selecting 100 years compared with other choices (Fuglestvedt et al., 2003; Shine, 2009). The choice of time horizon is a value judgement since it depends on the relative weight assigned to effects at different times.” [8]

A possible cause for concern in this case is that the authors did not adopt the same approach for non-livestock methane emissions. Goodland has since stated, “Because we questioned many aspects of the FAO’s work, we were reluctant to use their figures for methane, but did so anyway for livestock methane because we couldn’t find a more reliable figure”. [9] 

Goodland has argued that the impact of such an approach would have been more than offset by the fact that the number of livestock animals they based their assessments on (being the number used in “Livestock’s Long Shadow”) was far below the figure of 56 billion that the FAO’s statistical division had reported in 2007. He and Anhang became aware of the higher figure after their article was published.

The authors used the IPCC’s GWP estimate of 72 that applied at the time of the article. The IPCC has since increased the figure to 86 (incorporating carbon cycle feedbacks), while NASA estimates a figure of 105. [10]

With the rapid increase in extraction of unconventional fossil fuels since 2005, the growth in other anthropogenic sources of methane may have caused livestock’s share of emissions to reduce from what it would otherwise have been.

3. Foregone sequestration

The FAO allowed for emissions from land clearing in the year such changes occurred, with loss of carbon from vegetation and soil. However, it did not allow for the resultant ongoing loss of carbon sequestration.

Goodland and Anhang sought to allow for that factor to some extent. They suggested the possibility of allowing land that has been cleared for livestock grazing or feed crop production to regenerate as forest, thereby mitigating “as much as half (or even more) of anthropogenic GHGs” [greenhouse gases]. They argued that the land could, alternatively, be used to grow crops for direct human consumption or crops that could be converted to biofuels, thereby reducing our reliance on coal. They used the biofuel scenario in their calculations, incorporating the greenhouse gas emissions from the coal that is continuing to be used in lieu of the biofuels.

Goodland’s response to feedback to the 2009 World Watch article can be seen in his March/April, 2010 article, ‘Livestock and Climate Change’: Critical Comments and Responses (referred to above).

Australian Emissions

Estimates of animal agriculture’s share of Australian emissions range from the official figure of around 10 percent to 49 percent.

The Australian government’s 2012 National Inventory Report used a figure of 10.9 percent, representing the aggregate of: (a) enteric fermentation in the digestive systems of ruminant animals; and (b) manure management. The figure was based on a 100-year GWP for methane. [11]

The 49 percent figure is from the land use plan released in October 2014 by Beyond Zero Emissions and Melbourne Sustainable Society Institute (The University of Melbourne). The figure allows for factors such as: a 20-year GWP; livestock related land clearing and subsequent soil carbon loss; and livestock related non-carbon dioxide warming agents such as carbon monoxide and tropospheric ozone. [12]

The overall figure for animal agriculture may actually be higher than 49 percent using BZE’s calculations, as they have reported it solely in relation to rangeland grazing. However, their figure for all agriculture is only marginally higher, at 54 percent.

Cowspiracy: some modification may be beneficial

The documentary film Cowspiracy: The Sustainability Secret focuses on the environmental impacts of animal agriculture. Those behind it seem to have significantly raised community  awareness of this critical issue. [13]

I am yet to see the film, but have reviewed the climate change material from its website.

At the time of writing, the site’s “facts” page shows the FAO’s 2006 figure of 18 percent for animal agriculture. A footnote has been added, confirming the FAO’s 2013 estimate of 14.5 percent, as referred to above.

The page then states (with my underline), “livestock and their byproducts actually account for . . . at least 51 percent of all worldwide greenhouse gas emissions”.

The word “actually” implies an absolute, definitive figure, with none of the qualifying comments of the type I have referred to above. I am uncomfortable with the thought of relying on the figure in that way.

The site also indicates that “methane is 25-100 times more destructive than CO2” and “methane has a global warming power 86 times that of CO2”.

Both statements appear to be referring to methane’s GWP (global warming potential).

The presentation referred to for the figure of 86 is attributed to Erika Podest of NASA’s Jet Propulsion Laboratory. [14] However, it does not seem to refer to that figure, which is the IPCC’s current 20-year GWP after allowing for carbon cycle feedbacks. (Without those feedbacks, the IPCC’s current estimate is 84.)

Instead, the presentation refers to a GWP of 25 (slide 8), which is the 100-year figure from the IPCC’s 2007 Fourth Assessment Report. In its Fifth Assessment Report from 2013, the IPCC used a figure of 34.

The referenced article for the figures of 25-100 actually indicates an upper figure of 105. Perhaps ironically, it comes from NASA researchers. [10]

Please also see the postscript of 16th November, 2014 below.

The main message

Regardless of which approach is adopted, the key message must be that we will not overcome climate change without urgent action on both fossil fuels and animal agriculture.

The precise percentage share of the many contributors to greenhouse gas emissions matters little in that context.

An alternative poster

Here’s my contribution to the world of posters, which I like to believe accurately represents our current position.

The-ultimate-inconvenient-truth

Additional Comments

A large proportion of the organisations that partnered with the FAO in reviewing its methodology were major participants in the livestock sector. They included the European Feed Manufacturers’ Federation, the International Dairy Federation, the International Meat Secretariat, the International Egg Commission, and the International Poultry Council. [15]

The FAO is now indicating that meat consumption will increase by more than 70 percent by 2050, and has suggested various approaches for reducing relevant emissions. However, any improvement in the emissions intensity of production would be marginal relative to the reductions that could be achieved by a general move toward plant-based products.

The partnership also included the World Wildlife Fund (WWF), which has been accused of working with major business organisations that allegedly use the WWF brand to help improve their green credentials, while acting against the interests of the environment. [16]

As I have reported elsewhere, the partnership was chaired by Dr. Frank Mitloehner of the University of California, Davis, who has disclosed research funding from the National Cattlemen’s Beef Association. [17]

Author:  Paul Mahony (also on Twitter, Scribd, Slideshare and Viva la Vegan)

Related articles:Omissions of Emissions: a Critical Climate Change Issue” and “Cowspiracy and the Australian red meat industry

Postscript 16th November, 2014: I will comment elsewhere on other aspects of Cowspiracy’s “facts” page. However, one I will mention here is the suggestion that cows emit methane through “farting”. The cited article from the International Business Times appears to be incorrect in that regard, as the emissions primarily occur through belching, with a relatively small amount released from “manure management” (being a category specified in the National Greenhouse Accounts). It may seem a trivial issue, but I am concerned that it can appear within a page that people refer to as an authoritative resource. It also reinforces a major misconception about livestock’s emissions that causes many people to laugh them off.

Postscript 7th November 2021: The final image has been updated with one I used on my other website, Planetary Vegan.

Images:

Image from the People’s Climate March from video on the Facebook page of “Cowspiracy: The sustainability secret”, https://www.facebook.com/video.php?v=288706614654201

Final poster image © Gkuna | Dreamstime.comGrazing Cows Photo

References:

[1] Mahony, P., Omissions of Emissions: A Critical Climate Change Issue, Terrastendo, 9th February, 2013, https://terrastendo.net/2013/02/09/omissions-of-emissions-a-critical-climate-change-issue/

[2] Food and Agriculture Organization of the United Nations, 2006 “Livestock’s Long Shadow – Environmental Issues and Concerns”, p. xxi, Rome, http://www.fao.org/docrep/010/a0701e/a0701e00.HTM (Related FAO articles at http://www.fao.org/ag/magazine/0612sp1.htm; and http://www.fao.org/newsroom/en/news/2006/1000448/)

[3] Food and Agriculture Organization of the United Nations, 26th September, 2013, “Major cuts of greenhouse gas emissions from livestock within reach”, http://www.fao.org/news/story/en/item/197608/icode/

[4] Food and Agriculture Organization of the United Nations, “Methodology: Tackling climate change through livestock”, http://www.fao.org/news/story/en/item/197644/icode/

[5] Brainard, C., “Meat vs Miles”, The Observatory, 29th March, 2010, http://www.cjr.org/the_observatory/meat_vs_miles.php?page=all

[6] Goodland, R & Anhang, J, “Livestock and Climate Change – What if the key actors in climate change are cows, pigs, and chickens?”, World Watch, Nov/Dec, 2009, pp 10-19, http://www.worldwatch.org/files /pdf/Livestock%20and%20Climate%20Change.pdf

[7] Goodland, R., “Lifting lifestock’s long shadow”, Nature Climate Change 3, 2 (2013) doi:10.1038/nclimate1755, Published online 21 December 2012, http://www.nature.com/nclimate/journal/v3/n1/full/nclimate1755.html and http://www.readcube.com/articles/10.1038/nclimate1755

[8] Intergovernmental Panel on Climate Change, Fifth Assessment Report, 2014, http://www.ipcc.ch/report/ar5/, cited in Romm, J., “More Bad News For Fracking: IPCC Warns Methane Traps More Heat”, The Energy Collective, 7th October, 2013, http://theenergycollective.com/josephromm/284336/more-bad-news-fracking-ipcc-warns-methane-traps-much-more-heat-we-thought

[9] Goodland, R., “‘Livestock and Climate Change’: Critical Comments and Responses”, World Watch, Mar/Apr, 2010, http://www.chompingclimatechange.org/uploads/8/0/6/9/8069267/livestock_and_climate_change_critical_comments_and_responses.pdf

[10] Schindell, D.T.; Faluvegi, G.; Koch, D.M.; Schmidt, G.A.; Unger, N.; Bauer, S.E. “Improved Attribution of Climate Forcing to Emissions”, Science, 30 October 2009; Vol. 326 no. 5953 pp. 716-718; DOI: 10.1126/science.1174760, http://www.sciencemag.org/content/326/5953/716.figures-only

[11] Australian National Greenhouse Accounts National Inventory Report 2012, Volume 1, pp. 39 and 257, http://www.environment.gov.au/climate-change/greenhouse-gas-measurement/publications/national-inventory-report-2012

[12] Beyond Zero Emissions and Melbourne Sustainable Society Institute, The University of Melbourne, “Zero Carbon Australia, Land Use: Agriculture and Forestry Discussion Paper”, p. 68 & 97, October, 2014, http://bze.org.au/landuse

[13] “Cowspiracy: The Sustainability Secret”, http://www.cowspiracy.com/

[14] Podest, E., “Methane: its role as a greenhouse gas”, Greenhouse Gases Professional Development Workshop, Jet Propulsion Laboratory, Pasedena, California, 21st April, 2012, http://www.jpl.nasa.gov/education/pdfs/podest_ghg.pdf, cited in “Cowspiracy: The Facts”, http://www.cowspiracy.com/facts/

[15] Food and Agriculture Organization of the United Nations, “New effort to harmonize measurement of livestock’s environmental impacts”, 4th July, 2012, http://www.fao.org/news/story/en/item/150555/icode/

[16] Huismann, W., Panda Leaks: the dark side of the WWF“, cited in Vidal, J., “WWF International accused of ‘selling its soul’ to corporations”, The Guardian, 4th October, 2014, http://www.theguardian.com/environment/2014/oct/04/wwf-international-selling-its-soul-corporations

[17] Goodland, R., FAO’s New Parternship with the Livestock Industry“, Chomping Climate Change, 20th July, 2012, http://www.chompingclimatechange.org/blog/faos-new-parternship-with-the-livestock-industry

??????????????????????????????????????????????????????????????????????????????????????????????????????????

Note from author

For more up to date material in relation to “Cowspiracy”, please see my article An industry shooting itself in the foot, which consolidates and expands on material from this article and the article More on Cowspiracy and the Australian red meat industry.

Article: “Cowspiracy and the Australian red meat industry”

“Cowspiracy” is a documentary film focussing on the environmental impacts of animal agriculture. I am yet to see it, but organisations within the Australian red meat industry have posted comments about it on their Target 100 website.

In this post, I provide a preliminary response to the red meat industry’s claims. Those claims focus on the supposed difference between Australian and US meat production, and do not appear to require me to have seen the film in order to comment.

In 2012, I commented on claims made by Meat & Livestock Australia (MLA) on two websites that no longer exist. The web addresses currently link to the Target 100 website. My comments from that time can be seen in my article,Comments on Meat & Livestock Australia’s ‘Myth Busters’ and Other Claims“.

MLA’s partners on the Target 100 website are: Australian Lot Feeders Association; Sheep Meat Council of Australia; Cattle Council of Australia; and Australian Meat Industry Council.

Why is Australian beef different?

Meat Industry Claim: Cowspiracy focuses on the amount of land cleared in the Amazon to produce grain for cattle.  Australian farmers do not buy grain from the Amazon.

My response: As I have reported elsewhere, animal agriculture has been by far the major cause of land clearing in Australia. The gross and inherent inefficiency of animals as a food source causes us to use far more land than would otherwise be required.

Australia’s Chief Scientist has reported: “Based on data from typical perennial grasslands and mature forests in Australia, forests are typically more than 10 times as effective as grasslands at storing carbon on a hectare per hectare basis.”

The emissions performance of pasture degraded by livestock grazing would be far worse than indicated by that statement.

Meat Industry Claim: In Australia, most cattle graze on grass.  Even “grain fed” cattle spend most of their lives grazing grass.  At any one time, only around 2% of Australia’s cattle population is in feedlots.

My response: Beef from grass-fed cows is far more emissions intensive than grain-fed, as referred to in my articles “Some myths about meat” and “The 3 percent diet“.

Between regions, the emissions intensity of beef and other products can vary significantly, with factors such as feed digestibility, herd management practices, reproduction performance, and land clearing playing a part. According to the UN Food & Agriculture Organization (FAO), based on the factors they allowed for, Oceania’s performance (including Australia) is only marginally better than North America’s (including USA). Allowing for other factors, it may be far worse. I refer to some of them here in relation to Australia only.

Meat Industry Claim: In Australia, grain fed to livestock is either ‘feed grain’ quality, or grown solely for livestock consumption. Cattle are not consuming grains that humans can eat.

My response: The resources (including land) used to grow grain for cattle have many possible alternative uses, including grain production for humans or regeneration of natural habitat, helping to draw down existing atmospheric carbon as a critical climate change mitigation measure.

Meat Industry Claim: Australia’s livestock industry produces approximately 10 per cent of Australia’s total greenhouse gas emissions. Most of this is methane produced by the natural digestion process of cattle and sheep. Find out what the Australian industry is doing to research emissions reduction here.

My response: As I reported in my article “Omissions of Emissions: a Critical Climate Change Issue“, the figure of 10% is based solely on enteric fermentation in the digestive systems of ruminant animals (producing methane), and manure management (producing methane and nitrous oxide). Livestock-related land clearing and other factors are not allowed for. Based on 2008 numbers, I calculated a figure of 29.6% after allowing for a 20-year “global warming potential” (GWP) for methane and livestock-related land clearing and savanna burning.

In its recently released land use report, environmental group Beyond Zero Emissions arrived at a figure of 26% for 2010 after allowing for those factors. Additionally, taking into account emissions such as carbon monoxide and tropospheric ozone, they have estimated that emissions from Australian beef and sheep meat production represent around 49% of total national emissions. (Initial comments from BZE land use researcher, Gerard Wedderburn-Bisshop, in relation to the Target 100 article can be seen here.)

Meat Industry Claim: Using arid land for grazing cattle may actually be positive in Australia. See conservationist Dr Barry Trail [sic] TEDxSydney talk about this here.

My response: If Barry Traill’s approach is based on that of Allan Savory, then there is cause for concern. I need to review Traill’s approach further. I have commented on Savory’s methods in my article “Livestock and Climate: Why Allan Savory is not a saviour” and in an article about the founder of 350.org, Bill McKibben, “Do the math: there are too many cows“.

[Update 11th August, 2015: Please see item #1 of my 21st February, 2015 article “An industry shooting itself in the foot” for detailed comments on Dr Traill’s TEDx presentation.]

Meat Industry Claim: The Australian cattle and sheep industry invests around $13 million annually in research, development and extension programs to improve environmental performance. Find out more here.

My response: The emissions intensity figures of livestock and plant foods represent different paradigms. Research on animal-based foods is really only tweaking around the edges of the problem.

Meat Industry Claim: Australian production efficiencies have delivered a 5.3% reduction in emissions per tonne of beef produced since 1990 (Calculated using 2010 beef production data from MLA and from the 2009 National Greenhouse Gas Inventory).

My response: Refer to the previous response.

Meat Industry Claim: Life Cycle Assessment on Australian beef and lamb production systems showed that Australia has one of the lowest carbon emission profiles of any major meat-producing country.  The research was undertaken by the University of New South Wales in 2009.

My response:

The relevant paper notes that it was funded by MLA.

A key omission seems to be any reference to land clearing. The figures also exclude (unlike some life cycle assessments) emissions “associated with transport after the meat processing plant and other processing, retailing, or consumption activities”. The system boundary “encompasses all on-site and upstream processes at the farm, feedlot, and whole processing plant, including transport between these sites”.

Even with the shortcomings referred to above, the researchers reported emissions intensity figures (CF per kg of carcass) of 9.9 for grain-finished beef and 12.0 for grass-finished. If it is assumed that 72% of the carcass is usable, then the figures would become 13.75 for grain-finished beef and 16.7 for grass-finished beef.

Those results are still very poor compared to grains, vegetables and other products, and similar to aluminium which has at times consumed 16% of Australia’s (mainly coal-fired) electricity in the production process. They would be far worse if other factors referred to in this article, such as a 20-year GWP for methane, were factored in.

As a comparison, adjusting figures from the FAO for yield and a 20-year GWP, the emissions intensity of specialised beef in Oceania (which includes Australia) would be around 100 kg CO2-e/kg of product, while the figure for grass fed beef would exceed that figure.

What are the other problems with Cowspiracy?

Meat Industry Claim: Cowspiracy bases its arguments on the 2006 FAO Livestocks Long Shadow report, which claimed the sector contributes more greenhouse gas (GHG) than the entire transport sector. This statement has been retracted by the paper authors who have since accepted that the paper used two different methodologies to calculate greenhouse gas emissions, resulting in an unfair comparison to the beef industry. FAO  livestock policy officer Pierre Gerber told BBC News he accepted the criticism: “I must say honestly that he [Professor Mitloehner, UC Davis] has a point; we factored in everything for meat emissions, and we didn’t do the same thing with transport”. In Australia, energy generation represents 37 per cent of Australia’s emissions, compared to 10 per cent for livestock.

My response: Note comments above, indicating that the figure of 10 percent for Australia can be considered to be understated or overly conservative in many respects.

In 2013, the FAO revised its figure for livestock from 18 percent to 14.5 percent, and no longer compared it to transport. The former lead environment adviser to the World Bank, the late Robert Goodland, had been extremely critical of the FAO’s association with livestock industry bodies such as the International Meat Secretariat and the International Dairy Federation in reviewing its position. (Goodland was co-author, with Jeff Anhang, of a 2009 Worldwatch Magazine article on livestock’s climate change impacts, which I have referred to elsewhere.)

He was also critical in relation to the the appointment of Frank Mitloehner as chair of the new partnership formed to further assess livestock’s performance. He stated, “In fact, it would be good for the FAO to explain why it decided that the best choice as chair of its new partnership is Frank Mitloehner, an associate professor who has disclosed that his research has been funded by the National Cattlemen’s Beef Association. He is not a specialist in environmental assessment, while good practice in environmental assessment is to employ independent environmental assessment practitioners.”

Regardless of those concerns, the figure of 14.5% is a significant yet conservative estimate of livestock’s impact. (Please also see “other considerations” below.)

Meat Industry Claim: Cowspiracy deals only with beef production in the United States. The grain-fed system in the US is quite different from the grass and grain-fed industry in Australia, where cattle that are grain fed spend only 10-15 per cent of their lives in feedlots.

My response: Cows have evolved to eat grass, and grain-feeding is generally reserved for the later stages of their lives, as they would not survive for long on grains alone. As indicated above, grass-fed cows generally produce more emissions than grain-fed.

Meat Industry Claim: Cowspiracy alleges that no environmental group is looking at the beef industry due to the political power of the industry. This is the “conspiracy”. In fact, many environment groups focus their activism on the beef industry. The film even shows the logo for WWF, which has a very public program looking at the global beef industry through the Global Roundtable for Sustainable Beef.

My response: See my comments above about tweaking around the edges. A transformational change of diet is required, rather than a search for “sustainable beef”, which is a term I regard as an oxymoron in the context of our current environmental emergencies, including climate change.

In any event, the World Wildlife Fund (WWF), has been accused of working with major business organisations that allegedly use the WWF brand to help improve their green credentials, while acting against the interests of the environment.

Further considerations

The red meat industry can argue that aspects of its operations are more environmentally friendly than portrayed in Cowspiracy. However, any improvement will be relatively minor relative to what is required to overcome climate change.

If we are to have any chance of reducing the atmospheric concentration of carbon dioxide to the critical 350 ppm target suggested by leading climate scientist, Dr James Hansen and colleagues, then we must objectively and realistically address the issues of our reliance on fossil fuels, as well as reforestation, soil carbon and non-carbon dioxide warming agents, such as methane, nitrous oxide and black carbon. The essential role of coal, forestry and soil in achieving the target is demonstrated in the image below, from Hansen et al’s “Target Atmospheric CO2: Where Should Humanity Aim?” paper.

The only way to meaningfully reforest in the context of the climate emergency is to reduce the extent of animal agriculture.

Figure 1: CO2 Emissions and Atmospheric Concentration with Coal Phaseout by 2030

Hansen-target-atmospheric-co2

By the time the 350 ppm target could be achieved with action on land clearing and soil carbon (around 2090 based on IPCC’s estimates of oil and gas reserves and assuming an end to non-sequestered coal use by 2030), it would fall short at around 380 ppm if we were to ignore those factors. If we did so, then the target would not be achieved until well beyond 2150.

The role of agriculture, forestry and reductions in non-CO2 greenhouse gases (of which animal agriculture is a critical component) was highlighted in this extract from Hansen et al’s paper:

A reward system for improved agricultural and forestry practices that sequester carbon could remove the current CO2 overshoot. With simultaneous policies to reduce non-CO2 greenhouse gases, it appears still feasible to avert catastrophic climate change.

Conclusion

The red meat industry’s attempts to discredit Cowspiracy remind me of the denialist lobby’s attempts to thwart meaninful action on climate change generally. Precious time and energy will be diverted in any debate, when we must act urgently to address the problem.

We need to properly account for the true environmental cost of the industry’s products in the price paid by consumers, thereby creating price signals that will direct those consumers to the most environmentally beneficial products. We must also inform the community of the issues, as efficient markets require well informed participants.

We either want to retain a habitable planet or we do not. The choice is ours.

Author:  Paul Mahony (also on Twitter, Scribd, Slideshare and Viva la Vegan)

Please also see: More on Cowspiracy and the Australian red meat industry

Image: Australian herd of beef cattle live animals © Sheryl Caston | Dreamstime.com

Notes:

A reference list will be added.

Updates:

Comments on WWF added on 14th November, 2014. Source: Huismann, W., Panda Leaks: the dark side of the WWF“, cited in Vidal, J., “WWF International accused of ‘selling its soul’ to corporations”, The Guardian, 4th October, 2014, http://www.theguardian.com/environment/2014/oct/04/wwf-international-selling-its-soul-corporations

Comments on the Life Cycle Assessment were amended on 23rd February, 2015, including reference to FAO figures. The FAO reference is Food and Agriculture Organization of the United Nations, “Greenhouse gas emissions from ruminant supply chains: A global life cycle assessment”, Nov 2013, Fig. 12, p. 30,  http://www.fao.org/ag/againfo/resources/en/publications/tackling_climate_change/index.htm; http://www.fao.org/docrep/018/i3461e/i3461e.pdf

A related FAO reference (relevant to other comments within this article) is Food and Agriculture Organization of the United Nations, “Tackling climate change through livestock: A global assessment of  emissions and mitigation opportunities”, Nov 2013, http://www.fao.org/ag/againfo/resources/en/publications/tackling_climate_change/index.htm; http://www.fao.org/docrep/018/i3437e/i3437e.pdf

??????????????????????????????????????????????????????????????????????????????

Key climate change problems with livestock

I’ve mentioned previously that the link between livestock production and climate change involves many inter-related factors, including:

  • livestock’s inherent inefficiency as a food source;
  • the massive scale of the industry, including tens of billions of land animals slaughtered annually;
  • land clearing for feed crops and pasture;
  • extensive grazing on open rangelands, with resultant degradation and loss of soil carbon;
  • greenhouse gases such as carbon dioxide, methane and nitrous oxide, along with other warming agents such as black carbon.

In various respects, many official figures under-report livestock’s climate change impacts.  The under-reporting occurs because relevant factors are either: (a) omitted entirely; (b) classified under non-livestock headings; or (c) considered but with conservative calculations.

Greenhouse gas emissions intensity

In my April, 2014 article “Some myths about meat“, I referred to a November, 2013 report by the Food & Agriculture Organization of the United Nations (FAO), showing the emissions intensity of beef and other commodities. [1, 2] Emissions intensity represents the kilograms of greenhouse gas emissions per kilogram of product. The FAO report included some of the factors that are generally not allocated to livestock in official figures, including relevant land clearing.

For figures used in that article, I applied two additional factors, namely: (a) emissions per kilogram of end product (“retail weight”), rather than (as reported) emissions per kilogram of carcass weight; and (b) 20-year “global warming potential” (GWP) for methane, rather than (as reported) the 100-year figure.

I also compared the emissions from livestock to those from an incredibly emissions intensive product, aluminium. Some key points: (a) Aluminium smelting has at times consumed 16 percent of Australia’s electricity generation; (b) That’s particularly significant when you consider that Australia’s economy is the 12th largest in the world; (c) The emissions intensity of Australia’s aluminium smelting is 2.5 times the global average due to the fact that the electricity is primarily derived from coal. [3, 4, 5].

In June, 2014, researchers from Oxford University released their estimates of emissions intensity for a wide range of food products, as shown in Figure 1. The Oxford study was based on information that had previously been provided by around 55,000 participants ranging from high meat eaters to vegans. Consistent with findings elsewhere, the researchers reported that the emissions intensity of plant-based products was far lower than that of the animal-based alternatives. [6]

Figure 1: Greenhouse Gas Emissions Intensity of Food Products Consumed in the UK (Oxford study)

Emissions-intensity-table-Oxford-V.2-520-sharpened-large-text

I have used many of the Oxford figures, along with figures from the FAO for beef, chicken and pig meat, to create the comparison outlined in Figure 2.

Figure 2: Greenhouse Gas Emissions Intensity of various commodities

Emissions-intensity-charts-sharpened

Daily and weekly greenhouse gas emissions

Using the emissions intensity figures referred to above, I have calculated the emissions of some alternative daily food choices. The only difference between those choices are the foods enclosed in borders in Figure 3(a). Calories ranged from around 2,300 (fish-based) to around 2,600 (beef-based). Figure 3(c) shows the weekly emissions based on various combinations.

Figure 3 (a): Alternative food mixes

Ingredients-sharpened

Figure 3 (b): Daily greenhouse gas emissions of alternative food mixes (identified by key distinguishing ingredient)

Daily-emissions-500

Figure 3 (c): Greenhouse gas emissions of alternative food mixes (sample food intake for one week identified by key distinguishing ingredient)

Weekly-emissions-500

The 3 percent factor

The lowest-emissions choice (plant-based) results in around 3 percent of the emissions of the highest (based on grass-fed beef). Of course, people are unlikely to eat grass-fed beef every day, but the charts highlight the extent to which food choices can affect our overall greenhouse gas emissions.

Could a plant-based diet result in zero dietary emissions?

The person regarded by many as the world’s pre-eminent climate scientist, Dr James Hansen, has reported (with research colleagues) a maximum annual sequestration (absorption) potential of 1.6 gigatonnes of carbon through reforestation. [7] That equates to around 5.9 gigatonnes of carbon dioxide per year. [8] (Global carbon emissions in 2012 were 9.7 gigatonnes, equivalent to 35.6 gigatonnes of carbon dioxide.) [9]

Assuming that all those who currently eat meat converted to a plant-based diet, there would be around 5.8 billion new vegetarians globally, being the current population of around 7.3 billion less an estimated 1.5 billion who are already vegetarian. [10] Assuming that those people’s subsequent dietary greenhouse gas emissions were 2 kg per day on average, in aggregate they would be emitting around 4.2 gigatonnes of greenhouse gases through their diet annually. That is less than the 5.9 gigatonnes sequestered through reforestation, much of which would arise from the general transition to a plant-based diet.

On that basis, the benefit to be derived from those people converting to a plant-based diet, simply in terms of reforestation, may be greater than their ongoing diet-related emissions.

What about chicken and fish?

While emissions from diets featuring chicken and fish are comparable to the plant-based alternative, those two commodities in their own right are around three to four times as emissions intensive. They also involve other massive environmental problems, including destruction of oceanic ecosystems and waste from around 60 billion chickens bred and slaughtered annually.

Conclusion

We face a planetary emergency in the form of climate change, yet the critical issue of diet seems to be effectively ignored by most environmental campaigners. It’s time for those people and others to wake up and address the issue before it’s too late.

Author: Paul Mahony (also on Twitter, Slideshare and Scribd)

Updates

4th April, 2015: The retail figures attribute all carcass weight emissions to retail cuts of meat. If emissions are also attributed to other products that may be derived from the carcass, utilising fat, bone and the like, then the emissions intensity of the retail cuts will be around 28 percent lower than those shown here. For example, the maximum figure for grazed beef would be around 208, rather than 291 kg CO2-e/kg product, while the weekly diet based on grass-fed beef would be around 307 rather than 422 kg CO2-e/kg product. On that basis, the lowest-emissions choice (plant-based) would result in around 4.7 percent of the emissions of the highest (based on grass-fed beef). These figures ignore emissions from meat processing beyond the carcass stage, which would be relatively insignificant.

References

[1] Mahony, P. “Some myths about meat”, Terrastendo, 16th April, 2014, https://terrastendo.net/2014/04/16/some-myths-about-meat/

[2] Food and Agriculture Organization of the United Nations, “Tackling climate change through livestock: A global assessment of emissions and mitigation opportunities”, Nov 2013, http://www.fao.org/ag/againfo/resources/en/publications/tackling_climate_change/index.htm; http://www.fao.org/docrep/018/i3437e/i3437e.pdf

[3] Hamilton, C, “Scorcher: The Dirty Politics of Climate Change”, (2007) Black Inc Agenda, p. 40

[4] The World Bank, GDP Ranking, 8th May, 2014, http://data.worldbank.org/data-catalog/GDP-ranking-table

[5] Turton, H. “Greenhouse gas emissions in industrialised countries Where does Australia stand?”, The Australia Institute, Discussion Paper Number 66, June 2004, ISSN 1322-5421, p. viii, https://www.tai.org.au/documents/dp_fulltext/DP66.pdf

[6] Scarborough, P., Appleby, P.N., Mizdrak, A., Briggs, A.D.M., Travis, R.C., Bradbury, K.E., & Key, T.J., “Dietary greenhouse gas emissions of meat-eaters, fish-eaters, vegetarians and vegans in the UK”, Climatic Change, DOI 10.1007/s10584-014-1169-1, http://link.springer.com/article/10.1007%2Fs10584-014-1169-1

[7] Hansen, J; Sato, M; Kharecha, P; Beerling, D; Berner, R; Masson-Delmotte, V; Pagani, M; Raymo, M; Royer, D.L.; and Zachos, J.C. “Target Atmospheric CO2: Where Should Humanity Aim?”, 2008, Open Atmos. Sci. J., 2, Supplementary Material, p. xvi, doi:10.2174/1874282300802010217, http://pubs.giss.nasa.gov/docs/2008/2008_Hansen_etal_1.pdf

[8] IPCC Working Group III: Mitigation, IV Units, Conversion Factors, and GDP Deflators, http://www.ipcc.ch/ipccreports/tar/wg3/index.php?idp=477

[9] CO2Now.org, Global Carbon Emissions, http://co2now.org/Current-CO2/CO2-Now/global-carbon-emissions.html

[10] Leahy, E., Lyons, S., Tol, R.S.J., “An estimate of the number of vegetarians in the world”, ESRI Working Papers, The Economic and Social Research Institute (ESRI), 2010, http://hdl.handle.net/10419/50160 and http://www.econstor.eu/handle/10419/50160

Image: © Gkuna | Dreamstime.comGrazing Cows Photo

Moulin

We face a crisis in the form of climate change.

The crisis is being compounded by the failure of policymakers and bodies on whom they rely to adequately account for key factors when projecting its severity and impacts. Like some of his earlier material, some recent articles by prominent Australian climate change author David Spratt, and others, provide alarming insights and represent a call to action.

Climate feedbacks

At the heart of the issue are positive climate feedbacks, which exacerbate conditions that result from global warming. For example, receding sea ice exposes dark ocean, which absorbs more sunlight than white ice, thereby warming the ocean further and causing more ice to recede. The process continues and accelerates, thereby amplifying the impacts.

Some types of feedback occur faster than others. Those that are considered fast include:

  • changes in sea ice;
  • cloud cover;
  • water vapour; and
  • aerosols (particulates).

Slow feedbacks include:

  • increased vegetation at high latitudes;
  • ice sheet dynamics; and
  • further greenhouse gas emissions from the land and sea, such as methane escaping from melting permafrost (frozen soil) or from clathrates (frozen water molecules containing methane) in ocean sediment.

In order to avoid any confusion, it’s worth noting that sea-ice floats in water, whereas ice sheets sit on land. Melting sea ice creates massive problems but does not contribute directly to sea level rise, whereas melting ice caps do.

In “Climate Code Red: the case for emergency action” (2008), David Spratt and Philip Sutton explained that models used by the IPCC (Intergovernmental Panel on Climate Change) only take into account fast feedbacks, with no consideration of slow feedbacks. [1] They cited leading climate scientist James Hansen and colleagues from 2007, who argued that slow feedbacks were becoming significant on timescales as short as decades, and were therefore very relevant to near-term climate change impacts. [2]

Along the same lines, Spratt has recently reported that some of the supposedly slow feedbacks are likely to proceed “at a significant scale in the current hundred years”. He states that certain “fast” and “slow” feedback mechanisms are now occurring in parallel, rather than sequentially. [3]

We are faced with amplifying, non-linear trends, meaning that the history of human civilisation (covering a period of around ten thousand years) is no longer a reliable indicator of future impacts.

2°C of global warming is unacceptable

Spratt has also pointed out that climate policy-makers generally regard 2°C of global warming above pre-industrial levels as manageable and achievable by binding treaties and incremental, non-disruptive means. [4] The figure has been adopted by the United Nations Framework Convention on Climate Change (UNFCCC), albeit with consideration toward lowering it to 1.5°C in the near future.[5]

Here’s what Spratt and Sutton said in 2008, [6]:

A rise of 2 degrees over pre-industrial temperatures will initiate climate feedbacks in the oceans, on ice-sheets, and on the tundra, taking the Earth well past significant tipping points.

A tipping point is a threshold beyond which global or regional climate can change from one stable state to another. Further emissions can result in another tipping point being reached. Some of those emissions can be released from natural sources initially triggered by human-induced warming but now with feedbacks causing them to accelerate, potentially leading to runaway climate change. Methane released from melting permafrost (referred to earlier) is an example. Here are some comments from a 2011 report in The Independent, commenting on the experience of Russian scientists in monitoring permafrost (with my underlines). [7]

Dramatic and unprecedented plumes of methane . . . have been seen bubbling to the surface of the Arctic Ocean by scientists undertaking an extensive survey of the region.

The scale and volume of the methane release has astonished the head of the Russian research team who has been surveying the seabed of the east Siberian Arctic Shelf off northern Russia for nearly 20 years.

Igor Semiletov of the International Arctic Research Centre at the University of Alaska Fairbanks . . . said that he has never before witnessed the scale and force of the methane being released from beneath the Arctic seabed.

Dr Semiletov stated:

We carried out checks at about 115 stationary points and discovered methane fields of a fantastic scale – I think on a scale not seen before. Some of the plumes were a kilometre or more wide and the emissions went directly into the atmosphere – the concentration was a hundred times higher than normal.

Here’s a somewhat tamer, but still alarming, look at what was happening to permafrost in 2010, from researchers at The University of Alaska, Fairbanks [8]:

A more recent example was in the form of the massive craters that appeared in Siberia during July, 2014. Russian researchers have suggested that, with rising temperatures, permafrost has thawed and collapsed, releasing methane that had been trapped. [9]

Here’s an example of what’s been occurring on the Greenland ice sheet (as of 2009), featuring glaciologist, Dr Jason Box: [10]

https://www.youtube.com/watch?v=3F9FbdqGRsg

The Greenland ice sheet is almost 2,400 kilometres long, 1,100 kilometres across at its widest point and more than 2 kilometres thick. [11]

James Hansen has reported that, as recently as the 1990’s, it was neither gaining nor losing mass at a substantial rate. As of 2009 it was losing around 250 cubic kilometres of ice per year in a dynamic wet melting process. “The rate of ice sheet mass loss has doubled during the present decade [commencing in 2000].” [12]

What if a 2°C rise contributed to us reaching 4°C?

Here are some comments from eminent individuals and organisations [13]:

Royal Society (January, 2011)

In such a 4°C world, the limits for human adaptation are likely to be exceeded in many parts of the world, while the limits for adaptation for natural systems would largely be exceeded throughout the world.

Kevin Anderson, Deputy Director, Tyndall Centre for Climate Change Research (2009)

If you have got a population of nine billion by 2050 and you hit 4°C, 5°C or 6°C, you might have half a billion people surviving.

Professor Hans Joachim Schellnhuber of Germany’s Potsdam Institute for Climate Impact Research (June 2011):

A 4°C temperature increase probably means a global carrying capacity below 1 billion people.

The World Bank (Nov 2012):

There is no certainty that adaptation to a 4°C world is possible. The projected 4°C warming simply must not be allowed to occur.

There is no carbon budget left

Spratt refers to the concept of the carbon budget, which has become prominent in recent years, including in the IPCC’s 2013 Fifth Assessment Report. It is supposedly the difference between the total allowable greenhouse gas emissions for 2°C of warming, and the amount already emitted, and allows for significant emissions beyond those that have already occurred.

He points out that in the IPCC report, the lowest-risk carbon budget was based on a one-in-three chance of exceeding the 2°C threshold, that is to say, a one-in-three chance of failure. If the chance is lowered to one-in-ten, then based on an analysis by The Centre for Australian Weather and Climate Research, there is no carbon budget left. In other words, the carbon we have already emitted leaves us with a one-in-ten chance of exceeding 2°C above pre-industrial temperatures.[14]

Is that level of risk acceptable?

As Spratt’s “Climate Code Red” co-author, Philip Sutton has pointed out, in building a jet airliner, we would allow a notional failure rate of one in a million. [15] Here’s how the comparative risk factors can be depicted:

Acceptable-risks-4-resized-sharpened

Why do we accept much higher risks when considering the future of our planet than when we’re producing an aircraft, a building or a piece of equipment?

Is there a solution?

Kevin Anderson of the Tyndall Centre for Climate Research believes radical outcomes are unavoidable [16]:

Today, in 2013, we face an unavoidably radical future. We either continue with rising emissions, and reap the radical repercussions of severe climate change, or we acknowledge we have a choice and pursue radical emission reductions. No longer is there a non-radical option. Moreover, low-carbon supply technologies cannot deliver the necessary rate of emission reductions – they need to be complemented with rapid, deep and early reductions in energy consumption.

David Spratt argues that emergency action is essential:

Call it the great disruption, the war economy, emergency mode, or what you like; the story is still the same, and it is now the only remaining viable path.

It is time for political leaders and other key decision makers to face reality and enable the people they serve to do the same.

Our current predicament requires not only that we cease emitting greenhouse gases without further delay, but that we draw down significant amounts of atmospheric carbon through reforestation and other means.

Further comments on the climate emergency and required actions will follow in future posts.

Author: Paul Mahony (also on on Twitter, Slideshare and Scribd)

Postscript 27th August, 2014:

The Guardian newspaper reported on 24th August, 2014, that researchers in Germany estimate that the Greenland ice sheet is currently losing around 375 cubic kilometres (90 cubic miles) of ice per year, while Antarctica is losing around 125 cubic kilometres (30 cubic miles). [17] The combined total (500 cubic kilometres or 120 cubic miles) is equivalent to water approximately 1.4 metres (4 ft, 7 inches) deep across an area the size of Germany.

References:

[1] Spratt, D and Sutton, P, “Climate Code Red: The case for emergency action”, Scribe, 2008, p. 47

[2] Hansen, J. & Sato, M., “Global Warming: East-West Connections”, 25 September, 2007, http://www.columbia.edu/~jeh1/2007/EastWest_20070925.pdf, cited in Spratt, D. & Sutton, P. op. cit.

[3] Spratt, D., “Carbon budgets, climate sensitivity and the myth of ‘burnable carbon'”, Climate Code Red, 8th June, 2014, http://www.climatecodered.org/2014/06/carbon-budgets-climate-sensitivity-and.html

[4] Spratt, D., “The real budgetary emergency and the myth of “burnable carbon”, Climate Code Red, 22nd May, 2014, http://www.climatecodered.org/2014/05/the-real-budgetary-emergency-burnable.html

[5] Cambridge University, “Climate Change: Action, Trends and Implications for Business, The IPCC’s Fifth Assessment Report, Working Group 1“, p.5, http://www.cisl.cam.ac.uk/Resources/Climate-and-Energy/Science-Report.aspam; http://www.europeanclimate.org/documents/IPCCWebGuide.pdf

[6] Spratt, D and Sutton, P, op. cit. p.96

[7] Connor, S, “Vast methane ‘plumes’ seen in Arctic ocean as sea ice retreats”, The Independent, 13 December, 2011, http://www.independent.co.uk/news/science/vast-methane-plumes-seen-in-arctic-ocean-as-sea-ice-retreats-6276278.html

[8] University of Alaska, Fairbanks,Hunting for methane with Katey Walter Anthony, 15th January, 2010, https://www.youtube.com/watch?v=YegdEOSQotE

[9] Moskvitch, K., Mysterious Siberian crater attributed to methane“, Nature, 31st July, 2014, Nature doi:10.1038/nature.2014.15649, http://www.nature.com/news/mysterious-siberian-crater-attributed-to-methane-1.15649

[10] Salter, J., Scientists capture dramatic footage of Arctic glaciers melting in hours, The Telegraph, 20th February, 2009, http://www.telegraph.co.uk/earth/environment/climatechange/4734859/Scientists-capture-dramatic-footage-of-Arctic-glaciers-melting-in-hours.html; and https://www.youtube.com/watch?v=3F9FbdqGRsg

[11] Spratt, D and Sutton, P, op. cit., p. 20.

[12] Hansen, J, “Storms of my Grandchildren”, Bloomsbury, 2009, pp. 255-256 and p. 287. (An alternative ice loss figure to the quoted figure of 250 cubic km from p. 287 had been shown on p. 255 but the correct figure has been confirmed as 250 cubic km in emails of 15th and 16th June, 2011.)

[13] Dunlop, I.,The New Climate Emergency and Risk Management, Presentation at Breakthrough Climate Restoration Forum, 21st June, 2014, http://www.breakthrough2014.org/#!ian/c2048

[14] Raupach, M. R., I.N. Harman and J.G. Canadell (2011) “Global climate goals for temperature, concentrations, emissions and cumulative emissions”,  Report for the Department of Climate Change and Energy Efficiency. CAWCR Technical Report no. 42. Centre for Australian Weather and Climate Research, Melbourne, cited in Spratt, D., 22nd May, 2014, op. cit.

[15] Sutton, P., “A safe climate is still possible, but only if we change the way we campaign”, 14th November, 2013, Version 1d, p.9, http://www.green-innovations.asn.au/RSTI/A-safe-climate-is-still-possible.pdf

[16] Dunlop, I., op. cit.

[17] McKie, R., “‘Incredible’ rate of polar ice loss alarms scientists”, The Guardian, 24th August, 2014, http://www.theguardian.com/environment/2014/aug/24/incredible-polar-ice-loss-cryosat-antarctica-greenland?CMP=twt_gu

Images:

M. Todesco, Cryospheric Processes Laboratory, City College New York City, http://cryocity.org/, used with permission.

The Earth © Pmakin | Dreamstime.com

Commercial airliner flying midair after takeoff © Nils Weymann | Dreamstime.com

????????????????????????????????????????????????????????????????

On 19th August, 2014, The Guardian newspaper published a response by L Hunter Lovins to an earlier article by George Monbiot, in which Monbiot criticised the intensive grazing practices promoted by Allan Savory. [1], [2]

In her response, Lovins referred to the high carbon stores of America’s Great Plains soils and the world’s native grasslands. She said, “They got that way by co-evolving with pre-industrial grazing practices: sufficient herds of native graziers, dense packed by healthy populations of predators.”

As I mentioned in my article Do the math: There are too many cows!, due to human-engineered intensive breeding programs, current livestock populations dwarf those of earlier times. We are not comparing apples with apples when considering past natural grazing practices relative to modern extensive and intensive livestock production systems. [5]

Lovins also cited Polyface farm in the US as evidence that Savory’s approach works. But how successful is Polyface?

In his book CSIRO Perfidy, Geoff Russell reported that the farm (with generous rounding) produces 45 tonnes of food from 60 hectares per year. Russell says, “any plant food or collection of plant foods will wallop the productivity of Polyface”. He indicated that, at the bottom end of the range, an almond farmer could generate 60 tonnes from 60 hectares, for double the protein content of Polyface’s production. [3]

Anyone concerned about obtaining (for example) sufficient protein from plant-based food production may be interested in this table from my article Some thoughts on protein in a plant-based diet [4]:

Figure-1

Another example from Lovins was the Australian company, Sustainable Land Management (SLM). She did not provide a specific example of SLM’s work. However, the company’s website includes the single case study of “Padua“, involving two properties covering 44,000 hectares near Cunnamulla, Queensland. After acquiring the properties in 2012, the company created 200 paddocks by installing 580 kilometres of fencing, along with 98 kilometres of water pipes and 23 new water points.

In my article Livestock and climate: Why Allan Savory is not a saviour, I quoted Gerard Wedderburn-Bisshop, a former Principal Scientist with the Queensland Government Department of Environment and Resources Management Remote Sensing Centre [6]:

Conservation grazing . . . does work in the more temperate regions where rainfall and feed production can support the cost of fencing, but is not a cure-all as is proposed. . . . What Savory does not mention is that intensive (cell) grazing is only viable where water points are close and labour is cheap. Temporary or permanent fencing is labour intensive, moving herds daily requires far more labour input than most operations can afford.”

Wedderburn-Bisshop’s comments regarding “conservation grazing” were based on an article by Associate Professor Ian Lunt of Charles Sturt University, in which he stated, “. . . managed grazing creates an open habitat that is suitable for plants and animals that cannot persist beneath tall, thick grass. This mechanism is only relevant in a small number of Australian ecosystems – particularly lowland grasslands and grassy woodlands on productive soils in areas of moderate to high rainfall. . . . Grazing is not required to maintain diversity in all grassy ecosystems, and is rarely needed in dry, infertile sites where low fertility constrains grass growth.” [7]

Although Savory’s approach may allow revegetation on a relatively small scale, subject to adequate water resources and livestock controls, it would never be sufficient to feed the masses.

Wedderburn-Bisshop has also referred to the “fence line effect” in northern Australia, whereby bare ground will often exist on one side of a fence, while on the other there is knee-high native grass. The bare side will generally be owned by a pastoral company seeking to maximise its financial return. It will have increased stocking rates during times of favourable rainfall, then taken too long to reduce those rates during drought. The land becomes degraded, and carbon stores are significantly depleted. [8]

Lovins seems to have softened the claims of Savory, in that she talks of his practices “countering” climate change, rather than “reversing” it. I wonder if she believes that Savory has overstated the potential benefits of his methods, and is subtly stepping away from his most elaborate claim.

Savory and his supporters, including Lovins, may be akin to those who support fossil fuels in relation to climate change, promoting methods such as carbon capture and storage. Their approaches tweak systems that are fundamentally flawed, when far more simple and effective solutions are readily available.

Author: Paul Mahony (also on on Twitter, Slideshare and Scribd)

Note: Protein chart updated 21st February, 2016.

[1] Lovins, L. Hunter, Why George Monbiot is wrong: grazing livestock can save the world, The Guardian, 19th August, 2014, http://www.theguardian.com/sustainable-business/2014/aug/19/grazing-livestock-climate-change-george-monbiot-allan-savory?

[2] Monbiot, G.,Eat more meat and save the world: the latest implausible farming miracle, The Guardian, 4th August, 2014, http://www.theguardian.com/environment/georgemonbiot/2014/aug/04/eat-more-meat-and-save-the-world-the-latest-implausible-farming-miracle

[3] Russell, G., CSIRO Perfidy, Vivid Publishing, 2009, http://www.perfidy.com.au/

[4] Mahony, P., Some thoughts on protein in a plant-based diet, Terrastendo, 27th March, 2014, https://terrastendo.net/2014/03/17/some-thoughts-on-protein-in-a-plant-based-diet/

[5] Mahony, P., Do the math: There are too many cows!, Terrastendo, 26th July, 2013, https://terrastendo.net/2013/07/26/do-the-math-there-are-too-many-cows/

[6] Mahony, P.,Livestock and climate: Why Allan Savory is not a saviour, Terrastendo, 26th March, 2013, https://terrastendo.net/2013/03/26/livestock-and-climate-why-allan-savory-is-not-a-saviour/

[7] Lunt, I., Can livestock grazing benefit biodiversity?, The Conversation, 19th November, 2012, http://theconversation.edu.au/can-livestock-grazing-benefit-biodiversity-10789, citing Lunt, I., Eldridge, D.J., Morgan, J.W., Witt, G.B., Turner Review No. 13 – A framework to predict the effects of livestock grazing and grazing exclusion on conservation values in natural ecosystems in Australia“, Australian Journal of Botany 55(4) 401–415, http://dx.doi.org/10.1071/BT06178 and http://www.publish.csiro.au/paper/BT06178

[8] Mahony, P., Omissions of Emissions: A Critical Climate Change Issue, Terrastendo, 9th February, 2013, https://terrastendo.net/2013/02/09/omissions-of-emissions-a-critical-climate-change-issue/

Image: Cattle after Sunset © Joaobambu | Dreamstime.com


??????????????????????????????????????????????????????????????????

In March and July, 2013, I posted articles on Allan Savory and Bill McKibben. I subsequently added a number of postcripts. Here’s another, posted as a stand-alone article.

If you don’t know of them, Savory promotes intensive livestock grazing systems, and McKibben is the founder of climate change campaign group, 350.org.

I was prompted to post this article by a high-profile critique of Savory’s work by Guardian columnist, George Monbiot, published on 4th August, 2014. (Monbiot covered much of the material that I had referred to in my own article.)

I was criticising Savory for the lack of scientific evidence to support claims that his form of intensive livestock grazing could reverse climate change and prevent desertification. I was similarly critical of McKibben for his lack of evidence and detail in promoting intensively grazed systems.

McKibben was supporting Savory’s approach during a 2013 visit to Australia. He also seemed to be doing so in a 2010 article in Orion Magazine, but did not specifically refer to Savory at that time.

Some time back, I became aware that supporters of Savory appear to have taken credit for much of the material used in McKibben’s article. They did so in an April, 2010 discussion within the Soil Age Google Group.

The discussion included or referred to Adam Sacks, Seth Itzkan and Jim Laurie. You can see them pictured with Savory on the Savory Institute Hubs page.

A note from Itzkan to Sacks within the Google Group discussion indicated the extent to which group members and/or acquaintances had assisted McKibben:

This article is a direct result of your [Sacks’s] interaction with him and the subsequent correspondences that you, me, and Jim [Laurie] had with him in the following weeks, both the general theme, as well as the particulars and specifically all the language about electric fences, dung beetles, predators, and of course ‘methane-loving bacteria’.  He was profoundly influenced, and grateful for our influence, and I’m thankful to you for helping to make that connection.

As explained in my article on McKibben, the research on “methane loving bacteria” that Sacks referred to in a January, 2010 Grist article was subsequently found to be out by a factor of 1,000. A seemingly inadvertent error had occurred in reporting milligrams instead of micrograms.

I’m not aware of McKibben, Orion Magazine, Sacks or Grist correcting the articles. If they have not, then perhaps they should, particularly on such a critical issue.

Author: Paul Mahony (also on Twitter, Slideshare and Sribd)

References:

Mahony, P., Livestock and climate: Why Allan Savory is not a saviour”, Terrastendo, 26 Mar, 2013, https://terrastendo.net/2013/03/26/livestock-and-climate-why-allan-savory-is-not-a-saviour/

Mahony, P., Do the math: There are too many cows!, Terrastendo, 26th July, 2013, https://terrastendo.net/2013/07/26/do-the-math-there-are-too-many-cows/

Monbiot, G., Eat more meat and save the world: the latest implausible farming miracle, The Guardian, 4th August, 2014, http://www.theguardian.com/environment/georgemonbiot/2014/aug/04/eat-more-meat-and-save-the-world-the-latest-implausible-farming-miracle?CMP=fb_gu

McKibben, Bill, The only way to have a cow, Orion Magazine, Mar/Apr 2010, http://www.orionmagazine.org/index.php/articles/article/5339/

Sacks, A., The Climate Solution: Got Cows?”, Grist, 31 Jan, 2010, http://grist.org/article/the-climate-solution-got-cows/

Image: Cattle at sunset © Anthony Brown | Dreamstime.com


AntarcticaTemps_1957-2006

New research published in Geophysical Research Letters helps “explain the mechanism that is causing the rapid melting of the West Antarctic glaciers now being observed”. [1, 2]

However, according to the study’s lead author, Paul Spence of the University of New South Wales (UNSW), recent studies [3] suggesting the glaciers may have begun an irreversible melting “may prove optimistic because models had failed to account for how strengthening westerly winds in the Southern Ocean would start to impinge coastal easterlies, upsetting a delicate balance of warm and cold waters close to the Antarctic ice sheets”.

The research found that the coastal temperature structure of Antarctica was more sensitive to global warming, particularly changes to winds, than previously identified, leading to warm offshore water flooding into the ice-shelf regions and increasing the temperatures by 4 degrees Celsius under the ice shelf.

This research is additional to a study from May, 2014, which found that westerly winds in the Southern Ocean had quickened 10-15 percent over the past 50 years, and shifted 2 to 5 degrees closer to the South Pole. A co-author of that study, Matthew England of UNSW, was also a co-author of the latest report. The study had found that, in addition to the ozone hole over Antarctica, greenhouse gas emissions were contributing to the changing winds.[4]

The research highlights the rapidly changing nature of factors affecting climate change. Even before considering such developments, it is important to note that findings and projections from the Intergovernmental Panel on Climate Change (IPCC) are extremely conservative. Factors omitted from IPCC projections include the release of carbon from melting permafrost (frozen soil) around the Arctic and the dynamics of ice sheet loss on Greenland and Antarctica. Former Australian of the Year and head of the Climate Council, Professor Tim Flannery, has described IPCC reports as “painfully conservative”. [5]

Former head of NASA’s Goddard Institute for Space Studies, Dr James Hansen, has said that the IPCC treats sea level change basically as a linear process. He argues that it is more realistic that ice sheet disintegration will be non-linear, which is typical of a system that can collapse. [6]

Another concern is that, due to the time lag involved in producing reports, IPCC projections are generally out of date before they are published.

Commenting on the latest research, Tas van Ommen, a principal research scientist at the Australian Antarctic Division, has said: “Even 10 centimetres [4 inches] of sea-level rise tripled the flooding frequency of the world’s coastal regions.” [7]

With the increased likelihood and consequences of extreme events arising from climate change, governments, corporations and others need to consider and plan for a broad range of scenarios that go beyond the factors allowed for by the IPCC .

Author: Paul Mahony (also on SlideshareScribd, and Twitter)

References:

[1] Spence, P., Griffies, S.M., England, M.H., Hogg, A.M., Saenko, O.A., Jourdain, N.C., Geophysical Research Letters, “Rapid subsurface warming and circulation changes of Antarctic coastal waters by poleward shifting winds”, doi: 10.1002/2014GL060613, July, 2014, http://iopscience.iop.org/1748-9326/2/2/024002/fulltext/

[2] Hannam, P., “Bad news for sea-level rises as quickening Antarctic winds point to faster ice melt”, Sydney Morning Herald, 8th July, 2014, http://www.smh.com.au/environment/climate-change/bad-news-for-sealevel-rises-as-quickening-antarctic-winds-point-to-faster-ice-melt-20140707-zsz3o.html

[3] Rignot, E., Mouginot, J., Morlighem, M., Seroussi, H. and Scheuchl, B., “Widespread, rapid grounding line retreat of Pine Island, Thwaites, Smith, and Kohler glaciers, West Antarctica, from 1992 to 2011“, Geophysical Research Letters, Published online: 27 May, 2014, DOI: 10.1002/2014GL060140, Volume 41, Issue 10, pages 3502–3509, 28 May 2014, cited in Phillips, A., NASA Science “Science News”, “West Antarctic Glaciers in Irreversible Decline”, 12 May, 2014, http://science.nasa.gov/science-news/science-at-nasa/2014/12may_noturningback/

[4] Abram, N.J., Mulvaney, R., Vimeux, F., Phipps, S.J., Turner, J., England, M.H., “Evolution of the Southern Annular Mode during the past millennium”, Nature Climate Change, Volume: 4, Pages: 564–569, DOI: doi:10.1038/nclimate2235, published online 11th May, 2014, http://www.nature.com/nclimate/journal/v4/n7/full/nclimate2235.html

[5] Spratt, D, “Global Warming – No more business as usual: This is an emergency!”, Environmental Activists’ Conference 2008: Climate Emergency – No More Business as Usual, 10 October, 2008, reproduced in Links International Journal of Socialist Renewal, http://links.org.au/node/683

[6] Hansen, J., “Storms of my granchildren”, Bloomsbury, 2009, pp. 255-256.

[7] Hannam, P. op. cit.

Image: NASA Earth Observatory, Antarctic Warming Trends from 1957 to 2006, 23 Jan 2009, http://earthobservatory.nasa.gov/IOTD/view.php?id=36736

Related Presentation:Risk Management, Insurance and the Climate Crisis

Chicken-Meat-Production-detailed-2-resized-sharpened

1,048.

That’s the number of chickens killed for human consumption.

Per minute.

In Australia.

In 2011/12.

That’s over 1.5 million per day.

That’s 551 million for the year.

4.5 percent of chicken meat was exported.

That left the equivalent of 526 million chickens.

To feed (at that time) around 22 million people.

That’s 24 chickens for every man, woman and child.

The industry predicts that the number will increase to 628 million in 2015/16.

Figure 1: Chicken meat production in Australia

Chicken-Meat-Production-detailed-2-resized

That’s nearly 1,200 per minute.

That’s bizarre.

And obscene.

Chickens are beautiful and intelligent animals.

Not that beauty and intelligence should determine whether or not an animal is killed for food.

There is no need.

Apart from the slaughter process, chickens grown for meat suffer immense cruelty during their short lives.

Here’s a short clip of a sanctuary hen teaching and protecting her chick.

If you care to watch, perhaps think of a human mother teaching and protecting her young child.

Chickens and other animals used for food deserve much better than the horrendous lives we impose upon them. They are not here to serve humans.

Besides, by channeling grains through animals who are then killed to be eaten, we are causing other humans to starve due to the waste involved in an inherently inefficient system. The Food and Agriculture Organization of the United Nations reported in 2013 that 842 million people in 2011-13 were estimated to be suffering from chronic hunger.

After allowing for yield, 2.35 kilograms of grain needs to be fed to chickens to produce 1 kilogram of chicken meat. That’s equivalent to a loss of 57 percent.

The Australian Chicken Meat Federation has reported that chicken feed generally comprises 85-90 percent grains, such as wheat, sorghum, barley, oats, lupins, soybean meal, canola and other oilseed meals and grain legumes. The balance consists mainly of meat and bone meal and tallow.

We are also contributing massively to climate change and other environmental problems by causing far more resources (including land and fertiliser) to be used than would otherwise be required. As I have reported elsewhere, the greenhouse gas emissions intensity of chicken meat is many times that of plant-based alternatives of comparable nutritional value.

Bad for chickens.

Bad for people.

Bad for the planet.

If you haven’t done so already, isn’t it time to change?

Author: Paul Mahony (also on SlideshareScribd, and Twitter)

References:

Department of Agriculture, Fisheries and Forestry, “Australian Food Statistics 2011/12”, Table 2.4, Supply and use of Australian meats, http://www.daff.gov.au/__data/assets/pdf_file/0007/2269762/daff-foodstats-2011-12.pdf

Chicken’s feed conversion figure: Australian Chicken Meat Federation, Industry facts and figures, “Production Efficiency”, http://www.chicken.org.au/page.php?id=4 (accessed 7th May, 2014).

Chicken meat yield from live weight: United States Department of Agriculture Economic Research Service, “Agricultural Handbook No. 697”, June, 1992 (website updated 10 September, 2013), “Weights, Measures, and Conversion Factors for Agricultural Commodities and Their Products”, http://www.ers.usda.gov/publications/ah-agricultural-handbook/ah697.aspx#.U0ihR6Ikykw

Animals Australia “Broiler Chicken Fact Sheet”, http://www.animalsaustralia.org/factsheets/broiler_chickens.php (accessed 31 May, 2014)

Australian Chicken Meat Federation, “Growing Meat Chickens – Feed”, http://www.chicken.org.au/page.php?id=6#Feed (accessed 31 May, 2014)

Mahony, P., “The Electric Cow”, 27 May, 2014, https://terrastendo.net/2014/05/27/the-electric-cow/

Food and Agriculture Organization of the United Nations, “The State of Food Insecurity in the World 2013 “, http://www.fao.org/publications/sofi/en/

Images:

Main image created by author.

Chicken meat production chart: Australian Chicken Meat Federation, Industry Facts and Figures, Chicken Meat Production in Australia, http://www.chicken.org.au/page.php?id=4 (accessed 31 May, 2014)

Video:

Exerpt from “Peaceable Kingdom – the journey home” by Tribe of Heart, 2009, http://www.peaceablekingdomfilm.org/

Postscript 2nd June, 2014: Globally in 2011, we killed a staggering 110,000 chickens per minute for human consumption, or 58 billion in total. That’s around 105 times the number killed in Australia. Here is a list of slaughter numbers by animal, from the Food and Agriculture Organization of the United Nations.