Archives for category: Environment

??????????????????????????????????????????????????????????????????????????????????????????????????????????

Note from author

For more up to date material in relation to “Cowspiracy”, please see my article An industry shooting itself in the foot, which consolidates and expands on material from this article and the article More on Cowspiracy and the Australian red meat industry.

Article: “Cowspiracy and the Australian red meat industry”

“Cowspiracy” is a documentary film focussing on the environmental impacts of animal agriculture. I am yet to see it, but organisations within the Australian red meat industry have posted comments about it on their Target 100 website.

In this post, I provide a preliminary response to the red meat industry’s claims. Those claims focus on the supposed difference between Australian and US meat production, and do not appear to require me to have seen the film in order to comment.

In 2012, I commented on claims made by Meat & Livestock Australia (MLA) on two websites that no longer exist. The web addresses currently link to the Target 100 website. My comments from that time can be seen in my article,Comments on Meat & Livestock Australia’s ‘Myth Busters’ and Other Claims“.

MLA’s partners on the Target 100 website are: Australian Lot Feeders Association; Sheep Meat Council of Australia; Cattle Council of Australia; and Australian Meat Industry Council.

Why is Australian beef different?

Meat Industry Claim: Cowspiracy focuses on the amount of land cleared in the Amazon to produce grain for cattle.  Australian farmers do not buy grain from the Amazon.

My response: As I have reported elsewhere, animal agriculture has been by far the major cause of land clearing in Australia. The gross and inherent inefficiency of animals as a food source causes us to use far more land than would otherwise be required.

Australia’s Chief Scientist has reported: “Based on data from typical perennial grasslands and mature forests in Australia, forests are typically more than 10 times as effective as grasslands at storing carbon on a hectare per hectare basis.”

The emissions performance of pasture degraded by livestock grazing would be far worse than indicated by that statement.

Meat Industry Claim: In Australia, most cattle graze on grass.  Even “grain fed” cattle spend most of their lives grazing grass.  At any one time, only around 2% of Australia’s cattle population is in feedlots.

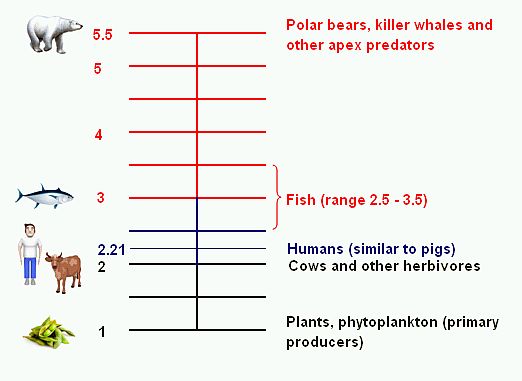
My response: Beef from grass-fed cows is far more emissions intensive than grain-fed, as referred to in my articles “Some myths about meat” and “The 3 percent diet“.

Between regions, the emissions intensity of beef and other products can vary significantly, with factors such as feed digestibility, herd management practices, reproduction performance, and land clearing playing a part. According to the UN Food & Agriculture Organization (FAO), based on the factors they allowed for, Oceania’s performance (including Australia) is only marginally better than North America’s (including USA). Allowing for other factors, it may be far worse. I refer to some of them here in relation to Australia only.

Meat Industry Claim: In Australia, grain fed to livestock is either ‘feed grain’ quality, or grown solely for livestock consumption. Cattle are not consuming grains that humans can eat.

My response: The resources (including land) used to grow grain for cattle have many possible alternative uses, including grain production for humans or regeneration of natural habitat, helping to draw down existing atmospheric carbon as a critical climate change mitigation measure.

Meat Industry Claim: Australia’s livestock industry produces approximately 10 per cent of Australia’s total greenhouse gas emissions. Most of this is methane produced by the natural digestion process of cattle and sheep. Find out what the Australian industry is doing to research emissions reduction here.

My response: As I reported in my article “Omissions of Emissions: a Critical Climate Change Issue“, the figure of 10% is based solely on enteric fermentation in the digestive systems of ruminant animals (producing methane), and manure management (producing methane and nitrous oxide). Livestock-related land clearing and other factors are not allowed for. Based on 2008 numbers, I calculated a figure of 29.6% after allowing for a 20-year “global warming potential” (GWP) for methane and livestock-related land clearing and savanna burning.

In its recently released land use report, environmental group Beyond Zero Emissions arrived at a figure of 26% for 2010 after allowing for those factors. Additionally, taking into account emissions such as carbon monoxide and tropospheric ozone, they have estimated that emissions from Australian beef and sheep meat production represent around 49% of total national emissions. (Initial comments from BZE land use researcher, Gerard Wedderburn-Bisshop, in relation to the Target 100 article can be seen here.)

Meat Industry Claim: Using arid land for grazing cattle may actually be positive in Australia. See conservationist Dr Barry Trail [sic] TEDxSydney talk about this here.

My response: If Barry Traill’s approach is based on that of Allan Savory, then there is cause for concern. I need to review Traill’s approach further. I have commented on Savory’s methods in my article “Livestock and Climate: Why Allan Savory is not a saviour” and in an article about the founder of 350.org, Bill McKibben, “Do the math: there are too many cows“.

[Update 11th August, 2015: Please see item #1 of my 21st February, 2015 article “An industry shooting itself in the foot” for detailed comments on Dr Traill’s TEDx presentation.]

Meat Industry Claim: The Australian cattle and sheep industry invests around $13 million annually in research, development and extension programs to improve environmental performance. Find out more here.

My response: The emissions intensity figures of livestock and plant foods represent different paradigms. Research on animal-based foods is really only tweaking around the edges of the problem.

Meat Industry Claim: Australian production efficiencies have delivered a 5.3% reduction in emissions per tonne of beef produced since 1990 (Calculated using 2010 beef production data from MLA and from the 2009 National Greenhouse Gas Inventory).

My response: Refer to the previous response.

Meat Industry Claim: Life Cycle Assessment on Australian beef and lamb production systems showed that Australia has one of the lowest carbon emission profiles of any major meat-producing country.  The research was undertaken by the University of New South Wales in 2009.

My response:

The relevant paper notes that it was funded by MLA.

A key omission seems to be any reference to land clearing. The figures also exclude (unlike some life cycle assessments) emissions “associated with transport after the meat processing plant and other processing, retailing, or consumption activities”. The system boundary “encompasses all on-site and upstream processes at the farm, feedlot, and whole processing plant, including transport between these sites”.

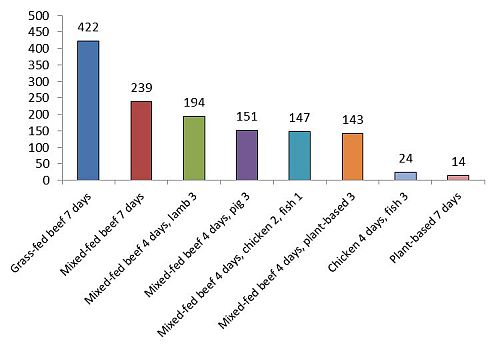
Even with the shortcomings referred to above, the researchers reported emissions intensity figures (CF per kg of carcass) of 9.9 for grain-finished beef and 12.0 for grass-finished. If it is assumed that 72% of the carcass is usable, then the figures would become 13.75 for grain-finished beef and 16.7 for grass-finished beef.

Those results are still very poor compared to grains, vegetables and other products, and similar to aluminium which has at times consumed 16% of Australia’s (mainly coal-fired) electricity in the production process. They would be far worse if other factors referred to in this article, such as a 20-year GWP for methane, were factored in.

As a comparison, adjusting figures from the FAO for yield and a 20-year GWP, the emissions intensity of specialised beef in Oceania (which includes Australia) would be around 100 kg CO2-e/kg of product, while the figure for grass fed beef would exceed that figure.

What are the other problems with Cowspiracy?

Meat Industry Claim: Cowspiracy bases its arguments on the 2006 FAO Livestocks Long Shadow report, which claimed the sector contributes more greenhouse gas (GHG) than the entire transport sector. This statement has been retracted by the paper authors who have since accepted that the paper used two different methodologies to calculate greenhouse gas emissions, resulting in an unfair comparison to the beef industry. FAO  livestock policy officer Pierre Gerber told BBC News he accepted the criticism: “I must say honestly that he [Professor Mitloehner, UC Davis] has a point; we factored in everything for meat emissions, and we didn’t do the same thing with transport”. In Australia, energy generation represents 37 per cent of Australia’s emissions, compared to 10 per cent for livestock.

My response: Note comments above, indicating that the figure of 10 percent for Australia can be considered to be understated or overly conservative in many respects.

In 2013, the FAO revised its figure for livestock from 18 percent to 14.5 percent, and no longer compared it to transport. The former lead environment adviser to the World Bank, the late Robert Goodland, had been extremely critical of the FAO’s association with livestock industry bodies such as the International Meat Secretariat and the International Dairy Federation in reviewing its position. (Goodland was co-author, with Jeff Anhang, of a 2009 Worldwatch Magazine article on livestock’s climate change impacts, which I have referred to elsewhere.)

He was also critical in relation to the the appointment of Frank Mitloehner as chair of the new partnership formed to further assess livestock’s performance. He stated, “In fact, it would be good for the FAO to explain why it decided that the best choice as chair of its new partnership is Frank Mitloehner, an associate professor who has disclosed that his research has been funded by the National Cattlemen’s Beef Association. He is not a specialist in environmental assessment, while good practice in environmental assessment is to employ independent environmental assessment practitioners.”

Regardless of those concerns, the figure of 14.5% is a significant yet conservative estimate of livestock’s impact. (Please also see “other considerations” below.)

Meat Industry Claim: Cowspiracy deals only with beef production in the United States. The grain-fed system in the US is quite different from the grass and grain-fed industry in Australia, where cattle that are grain fed spend only 10-15 per cent of their lives in feedlots.

My response: Cows have evolved to eat grass, and grain-feeding is generally reserved for the later stages of their lives, as they would not survive for long on grains alone. As indicated above, grass-fed cows generally produce more emissions than grain-fed.

Meat Industry Claim: Cowspiracy alleges that no environmental group is looking at the beef industry due to the political power of the industry. This is the “conspiracy”. In fact, many environment groups focus their activism on the beef industry. The film even shows the logo for WWF, which has a very public program looking at the global beef industry through the Global Roundtable for Sustainable Beef.

My response: See my comments above about tweaking around the edges. A transformational change of diet is required, rather than a search for “sustainable beef”, which is a term I regard as an oxymoron in the context of our current environmental emergencies, including climate change.

In any event, the World Wildlife Fund (WWF), has been accused of working with major business organisations that allegedly use the WWF brand to help improve their green credentials, while acting against the interests of the environment.

Further considerations

The red meat industry can argue that aspects of its operations are more environmentally friendly than portrayed in Cowspiracy. However, any improvement will be relatively minor relative to what is required to overcome climate change.

If we are to have any chance of reducing the atmospheric concentration of carbon dioxide to the critical 350 ppm target suggested by leading climate scientist, Dr James Hansen and colleagues, then we must objectively and realistically address the issues of our reliance on fossil fuels, as well as reforestation, soil carbon and non-carbon dioxide warming agents, such as methane, nitrous oxide and black carbon. The essential role of coal, forestry and soil in achieving the target is demonstrated in the image below, from Hansen et al’s “Target Atmospheric CO2: Where Should Humanity Aim?” paper.

The only way to meaningfully reforest in the context of the climate emergency is to reduce the extent of animal agriculture.

Figure 1: CO2 Emissions and Atmospheric Concentration with Coal Phaseout by 2030

Hansen-target-atmospheric-co2

By the time the 350 ppm target could be achieved with action on land clearing and soil carbon (around 2090 based on IPCC’s estimates of oil and gas reserves and assuming an end to non-sequestered coal use by 2030), it would fall short at around 380 ppm if we were to ignore those factors. If we did so, then the target would not be achieved until well beyond 2150.

The role of agriculture, forestry and reductions in non-CO2 greenhouse gases (of which animal agriculture is a critical component) was highlighted in this extract from Hansen et al’s paper:

A reward system for improved agricultural and forestry practices that sequester carbon could remove the current CO2 overshoot. With simultaneous policies to reduce non-CO2 greenhouse gases, it appears still feasible to avert catastrophic climate change.

Conclusion

The red meat industry’s attempts to discredit Cowspiracy remind me of the denialist lobby’s attempts to thwart meaninful action on climate change generally. Precious time and energy will be diverted in any debate, when we must act urgently to address the problem.

We need to properly account for the true environmental cost of the industry’s products in the price paid by consumers, thereby creating price signals that will direct those consumers to the most environmentally beneficial products. We must also inform the community of the issues, as efficient markets require well informed participants.

We either want to retain a habitable planet or we do not. The choice is ours.

Author:  Paul Mahony (also on Twitter, Scribd, Slideshare and Viva la Vegan)

Please also see: More on Cowspiracy and the Australian red meat industry

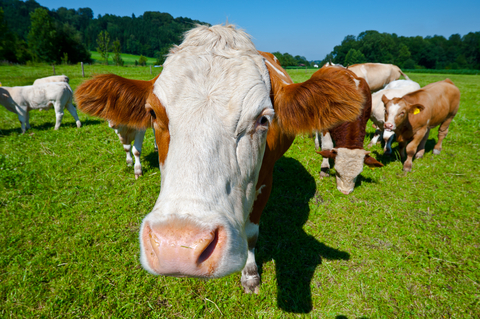
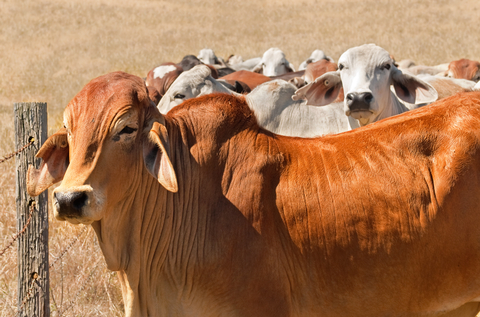
Image: Australian herd of beef cattle live animals © Sheryl Caston | Dreamstime.com

Notes:

A reference list will be added.

Updates:

Comments on WWF added on 14th November, 2014. Source: Huismann, W., Panda Leaks: the dark side of the WWF“, cited in Vidal, J., “WWF International accused of ‘selling its soul’ to corporations”, The Guardian, 4th October, 2014, http://www.theguardian.com/environment/2014/oct/04/wwf-international-selling-its-soul-corporations

Comments on the Life Cycle Assessment were amended on 23rd February, 2015, including reference to FAO figures. The FAO reference is Food and Agriculture Organization of the United Nations, “Greenhouse gas emissions from ruminant supply chains: A global life cycle assessment”, Nov 2013, Fig. 12, p. 30,  http://www.fao.org/ag/againfo/resources/en/publications/tackling_climate_change/index.htm; http://www.fao.org/docrep/018/i3461e/i3461e.pdf

A related FAO reference (relevant to other comments within this article) is Food and Agriculture Organization of the United Nations, “Tackling climate change through livestock: A global assessment of  emissions and mitigation opportunities”, Nov 2013, http://www.fao.org/ag/againfo/resources/en/publications/tackling_climate_change/index.htm; http://www.fao.org/docrep/018/i3437e/i3437e.pdf

??????????????????????????????????????????????????????????????????????????????

Key climate change problems with livestock

I’ve mentioned previously that the link between livestock production and climate change involves many inter-related factors, including:

  • livestock’s inherent inefficiency as a food source;
  • the massive scale of the industry, including tens of billions of land animals slaughtered annually;
  • land clearing for feed crops and pasture;
  • extensive grazing on open rangelands, with resultant degradation and loss of soil carbon;
  • greenhouse gases such as carbon dioxide, methane and nitrous oxide, along with other warming agents such as black carbon.

In various respects, many official figures under-report livestock’s climate change impacts.  The under-reporting occurs because relevant factors are either: (a) omitted entirely; (b) classified under non-livestock headings; or (c) considered but with conservative calculations.

Greenhouse gas emissions intensity

In my April, 2014 article “Some myths about meat“, I referred to a November, 2013 report by the Food & Agriculture Organization of the United Nations (FAO), showing the emissions intensity of beef and other commodities. [1, 2] Emissions intensity represents the kilograms of greenhouse gas emissions per kilogram of product. The FAO report included some of the factors that are generally not allocated to livestock in official figures, including relevant land clearing.

For figures used in that article, I applied two additional factors, namely: (a) emissions per kilogram of end product (“retail weight”), rather than (as reported) emissions per kilogram of carcass weight; and (b) 20-year “global warming potential” (GWP) for methane, rather than (as reported) the 100-year figure.

I also compared the emissions from livestock to those from an incredibly emissions intensive product, aluminium. Some key points: (a) Aluminium smelting has at times consumed 16 percent of Australia’s electricity generation; (b) That’s particularly significant when you consider that Australia’s economy is the 12th largest in the world; (c) The emissions intensity of Australia’s aluminium smelting is 2.5 times the global average due to the fact that the electricity is primarily derived from coal. [3, 4, 5].

In June, 2014, researchers from Oxford University released their estimates of emissions intensity for a wide range of food products, as shown in Figure 1. The Oxford study was based on information that had previously been provided by around 55,000 participants ranging from high meat eaters to vegans. Consistent with findings elsewhere, the researchers reported that the emissions intensity of plant-based products was far lower than that of the animal-based alternatives. [6]

Figure 1: Greenhouse Gas Emissions Intensity of Food Products Consumed in the UK (Oxford study)

Emissions-intensity-table-Oxford-V.2-520-sharpened-large-text

I have used many of the Oxford figures, along with figures from the FAO for beef, chicken and pig meat, to create the comparison outlined in Figure 2.

Figure 2: Greenhouse Gas Emissions Intensity of various commodities

Emissions-intensity-charts-sharpened

Daily and weekly greenhouse gas emissions

Using the emissions intensity figures referred to above, I have calculated the emissions of some alternative daily food choices. The only difference between those choices are the foods enclosed in borders in Figure 3(a). Calories ranged from around 2,300 (fish-based) to around 2,600 (beef-based). Figure 3(c) shows the weekly emissions based on various combinations.

Figure 3 (a): Alternative food mixes

Ingredients-sharpened

Figure 3 (b): Daily greenhouse gas emissions of alternative food mixes (identified by key distinguishing ingredient)

Daily-emissions-500

Figure 3 (c): Greenhouse gas emissions of alternative food mixes (sample food intake for one week identified by key distinguishing ingredient)

Weekly-emissions-500

The 3 percent factor

The lowest-emissions choice (plant-based) results in around 3 percent of the emissions of the highest (based on grass-fed beef). Of course, people are unlikely to eat grass-fed beef every day, but the charts highlight the extent to which food choices can affect our overall greenhouse gas emissions.

Could a plant-based diet result in zero dietary emissions?

The person regarded by many as the world’s pre-eminent climate scientist, Dr James Hansen, has reported (with research colleagues) a maximum annual sequestration (absorption) potential of 1.6 gigatonnes of carbon through reforestation. [7] That equates to around 5.9 gigatonnes of carbon dioxide per year. [8] (Global carbon emissions in 2012 were 9.7 gigatonnes, equivalent to 35.6 gigatonnes of carbon dioxide.) [9]

Assuming that all those who currently eat meat converted to a plant-based diet, there would be around 5.8 billion new vegetarians globally, being the current population of around 7.3 billion less an estimated 1.5 billion who are already vegetarian. [10] Assuming that those people’s subsequent dietary greenhouse gas emissions were 2 kg per day on average, in aggregate they would be emitting around 4.2 gigatonnes of greenhouse gases through their diet annually. That is less than the 5.9 gigatonnes sequestered through reforestation, much of which would arise from the general transition to a plant-based diet.

On that basis, the benefit to be derived from those people converting to a plant-based diet, simply in terms of reforestation, may be greater than their ongoing diet-related emissions.

What about chicken and fish?

While emissions from diets featuring chicken and fish are comparable to the plant-based alternative, those two commodities in their own right are around three to four times as emissions intensive. They also involve other massive environmental problems, including destruction of oceanic ecosystems and waste from around 60 billion chickens bred and slaughtered annually.

Conclusion

We face a planetary emergency in the form of climate change, yet the critical issue of diet seems to be effectively ignored by most environmental campaigners. It’s time for those people and others to wake up and address the issue before it’s too late.

Author: Paul Mahony (also on Twitter, Slideshare and Scribd)

Updates

4th April, 2015: The retail figures attribute all carcass weight emissions to retail cuts of meat. If emissions are also attributed to other products that may be derived from the carcass, utilising fat, bone and the like, then the emissions intensity of the retail cuts will be around 28 percent lower than those shown here. For example, the maximum figure for grazed beef would be around 208, rather than 291 kg CO2-e/kg product, while the weekly diet based on grass-fed beef would be around 307 rather than 422 kg CO2-e/kg product. On that basis, the lowest-emissions choice (plant-based) would result in around 4.7 percent of the emissions of the highest (based on grass-fed beef). These figures ignore emissions from meat processing beyond the carcass stage, which would be relatively insignificant.

References

[1] Mahony, P. “Some myths about meat”, Terrastendo, 16th April, 2014, https://terrastendo.net/2014/04/16/some-myths-about-meat/

[2] Food and Agriculture Organization of the United Nations, “Tackling climate change through livestock: A global assessment of emissions and mitigation opportunities”, Nov 2013, http://www.fao.org/ag/againfo/resources/en/publications/tackling_climate_change/index.htm; http://www.fao.org/docrep/018/i3437e/i3437e.pdf

[3] Hamilton, C, “Scorcher: The Dirty Politics of Climate Change”, (2007) Black Inc Agenda, p. 40

[4] The World Bank, GDP Ranking, 8th May, 2014, http://data.worldbank.org/data-catalog/GDP-ranking-table

[5] Turton, H. “Greenhouse gas emissions in industrialised countries Where does Australia stand?”, The Australia Institute, Discussion Paper Number 66, June 2004, ISSN 1322-5421, p. viii, https://www.tai.org.au/documents/dp_fulltext/DP66.pdf

[6] Scarborough, P., Appleby, P.N., Mizdrak, A., Briggs, A.D.M., Travis, R.C., Bradbury, K.E., & Key, T.J., “Dietary greenhouse gas emissions of meat-eaters, fish-eaters, vegetarians and vegans in the UK”, Climatic Change, DOI 10.1007/s10584-014-1169-1, http://link.springer.com/article/10.1007%2Fs10584-014-1169-1

[7] Hansen, J; Sato, M; Kharecha, P; Beerling, D; Berner, R; Masson-Delmotte, V; Pagani, M; Raymo, M; Royer, D.L.; and Zachos, J.C. “Target Atmospheric CO2: Where Should Humanity Aim?”, 2008, Open Atmos. Sci. J., 2, Supplementary Material, p. xvi, doi:10.2174/1874282300802010217, http://pubs.giss.nasa.gov/docs/2008/2008_Hansen_etal_1.pdf

[8] IPCC Working Group III: Mitigation, IV Units, Conversion Factors, and GDP Deflators, http://www.ipcc.ch/ipccreports/tar/wg3/index.php?idp=477

[9] CO2Now.org, Global Carbon Emissions, http://co2now.org/Current-CO2/CO2-Now/global-carbon-emissions.html

[10] Leahy, E., Lyons, S., Tol, R.S.J., “An estimate of the number of vegetarians in the world”, ESRI Working Papers, The Economic and Social Research Institute (ESRI), 2010, http://hdl.handle.net/10419/50160 and http://www.econstor.eu/handle/10419/50160

Image: © Gkuna | Dreamstime.comGrazing Cows Photo

Moulin

We face a crisis in the form of climate change.

The crisis is being compounded by the failure of policymakers and bodies on whom they rely to adequately account for key factors when projecting its severity and impacts. Like some of his earlier material, some recent articles by prominent Australian climate change author David Spratt, and others, provide alarming insights and represent a call to action.

Climate feedbacks

At the heart of the issue are positive climate feedbacks, which exacerbate conditions that result from global warming. For example, receding sea ice exposes dark ocean, which absorbs more sunlight than white ice, thereby warming the ocean further and causing more ice to recede. The process continues and accelerates, thereby amplifying the impacts.

Some types of feedback occur faster than others. Those that are considered fast include:

  • changes in sea ice;
  • cloud cover;
  • water vapour; and
  • aerosols (particulates).

Slow feedbacks include:

  • increased vegetation at high latitudes;
  • ice sheet dynamics; and
  • further greenhouse gas emissions from the land and sea, such as methane escaping from melting permafrost (frozen soil) or from clathrates (frozen water molecules containing methane) in ocean sediment.

In order to avoid any confusion, it’s worth noting that sea-ice floats in water, whereas ice sheets sit on land. Melting sea ice creates massive problems but does not contribute directly to sea level rise, whereas melting ice caps do.

In “Climate Code Red: the case for emergency action” (2008), David Spratt and Philip Sutton explained that models used by the IPCC (Intergovernmental Panel on Climate Change) only take into account fast feedbacks, with no consideration of slow feedbacks. [1] They cited leading climate scientist James Hansen and colleagues from 2007, who argued that slow feedbacks were becoming significant on timescales as short as decades, and were therefore very relevant to near-term climate change impacts. [2]

Along the same lines, Spratt has recently reported that some of the supposedly slow feedbacks are likely to proceed “at a significant scale in the current hundred years”. He states that certain “fast” and “slow” feedback mechanisms are now occurring in parallel, rather than sequentially. [3]

We are faced with amplifying, non-linear trends, meaning that the history of human civilisation (covering a period of around ten thousand years) is no longer a reliable indicator of future impacts.

2°C of global warming is unacceptable

Spratt has also pointed out that climate policy-makers generally regard 2°C of global warming above pre-industrial levels as manageable and achievable by binding treaties and incremental, non-disruptive means. [4] The figure has been adopted by the United Nations Framework Convention on Climate Change (UNFCCC), albeit with consideration toward lowering it to 1.5°C in the near future.[5]

Here’s what Spratt and Sutton said in 2008, [6]:

A rise of 2 degrees over pre-industrial temperatures will initiate climate feedbacks in the oceans, on ice-sheets, and on the tundra, taking the Earth well past significant tipping points.

A tipping point is a threshold beyond which global or regional climate can change from one stable state to another. Further emissions can result in another tipping point being reached. Some of those emissions can be released from natural sources initially triggered by human-induced warming but now with feedbacks causing them to accelerate, potentially leading to runaway climate change. Methane released from melting permafrost (referred to earlier) is an example. Here are some comments from a 2011 report in The Independent, commenting on the experience of Russian scientists in monitoring permafrost (with my underlines). [7]

Dramatic and unprecedented plumes of methane . . . have been seen bubbling to the surface of the Arctic Ocean by scientists undertaking an extensive survey of the region.

The scale and volume of the methane release has astonished the head of the Russian research team who has been surveying the seabed of the east Siberian Arctic Shelf off northern Russia for nearly 20 years.

Igor Semiletov of the International Arctic Research Centre at the University of Alaska Fairbanks . . . said that he has never before witnessed the scale and force of the methane being released from beneath the Arctic seabed.

Dr Semiletov stated:

We carried out checks at about 115 stationary points and discovered methane fields of a fantastic scale – I think on a scale not seen before. Some of the plumes were a kilometre or more wide and the emissions went directly into the atmosphere – the concentration was a hundred times higher than normal.

Here’s a somewhat tamer, but still alarming, look at what was happening to permafrost in 2010, from researchers at The University of Alaska, Fairbanks [8]:

A more recent example was in the form of the massive craters that appeared in Siberia during July, 2014. Russian researchers have suggested that, with rising temperatures, permafrost has thawed and collapsed, releasing methane that had been trapped. [9]

Here’s an example of what’s been occurring on the Greenland ice sheet (as of 2009), featuring glaciologist, Dr Jason Box: [10]

https://www.youtube.com/watch?v=3F9FbdqGRsg

The Greenland ice sheet is almost 2,400 kilometres long, 1,100 kilometres across at its widest point and more than 2 kilometres thick. [11]

James Hansen has reported that, as recently as the 1990’s, it was neither gaining nor losing mass at a substantial rate. As of 2009 it was losing around 250 cubic kilometres of ice per year in a dynamic wet melting process. “The rate of ice sheet mass loss has doubled during the present decade [commencing in 2000].” [12]

What if a 2°C rise contributed to us reaching 4°C?

Here are some comments from eminent individuals and organisations [13]:

Royal Society (January, 2011)

In such a 4°C world, the limits for human adaptation are likely to be exceeded in many parts of the world, while the limits for adaptation for natural systems would largely be exceeded throughout the world.

Kevin Anderson, Deputy Director, Tyndall Centre for Climate Change Research (2009)

If you have got a population of nine billion by 2050 and you hit 4°C, 5°C or 6°C, you might have half a billion people surviving.

Professor Hans Joachim Schellnhuber of Germany’s Potsdam Institute for Climate Impact Research (June 2011):

A 4°C temperature increase probably means a global carrying capacity below 1 billion people.

The World Bank (Nov 2012):

There is no certainty that adaptation to a 4°C world is possible. The projected 4°C warming simply must not be allowed to occur.

There is no carbon budget left

Spratt refers to the concept of the carbon budget, which has become prominent in recent years, including in the IPCC’s 2013 Fifth Assessment Report. It is supposedly the difference between the total allowable greenhouse gas emissions for 2°C of warming, and the amount already emitted, and allows for significant emissions beyond those that have already occurred.

He points out that in the IPCC report, the lowest-risk carbon budget was based on a one-in-three chance of exceeding the 2°C threshold, that is to say, a one-in-three chance of failure. If the chance is lowered to one-in-ten, then based on an analysis by The Centre for Australian Weather and Climate Research, there is no carbon budget left. In other words, the carbon we have already emitted leaves us with a one-in-ten chance of exceeding 2°C above pre-industrial temperatures.[14]

Is that level of risk acceptable?

As Spratt’s “Climate Code Red” co-author, Philip Sutton has pointed out, in building a jet airliner, we would allow a notional failure rate of one in a million. [15] Here’s how the comparative risk factors can be depicted:

Acceptable-risks-4-resized-sharpened

Why do we accept much higher risks when considering the future of our planet than when we’re producing an aircraft, a building or a piece of equipment?

Is there a solution?

Kevin Anderson of the Tyndall Centre for Climate Research believes radical outcomes are unavoidable [16]:

Today, in 2013, we face an unavoidably radical future. We either continue with rising emissions, and reap the radical repercussions of severe climate change, or we acknowledge we have a choice and pursue radical emission reductions. No longer is there a non-radical option. Moreover, low-carbon supply technologies cannot deliver the necessary rate of emission reductions – they need to be complemented with rapid, deep and early reductions in energy consumption.

David Spratt argues that emergency action is essential:

Call it the great disruption, the war economy, emergency mode, or what you like; the story is still the same, and it is now the only remaining viable path.

It is time for political leaders and other key decision makers to face reality and enable the people they serve to do the same.

Our current predicament requires not only that we cease emitting greenhouse gases without further delay, but that we draw down significant amounts of atmospheric carbon through reforestation and other means.

Further comments on the climate emergency and required actions will follow in future posts.

Author: Paul Mahony (also on on Twitter, Slideshare and Scribd)

Postscript 27th August, 2014:

The Guardian newspaper reported on 24th August, 2014, that researchers in Germany estimate that the Greenland ice sheet is currently losing around 375 cubic kilometres (90 cubic miles) of ice per year, while Antarctica is losing around 125 cubic kilometres (30 cubic miles). [17] The combined total (500 cubic kilometres or 120 cubic miles) is equivalent to water approximately 1.4 metres (4 ft, 7 inches) deep across an area the size of Germany.

References:

[1] Spratt, D and Sutton, P, “Climate Code Red: The case for emergency action”, Scribe, 2008, p. 47

[2] Hansen, J. & Sato, M., “Global Warming: East-West Connections”, 25 September, 2007, http://www.columbia.edu/~jeh1/2007/EastWest_20070925.pdf, cited in Spratt, D. & Sutton, P. op. cit.

[3] Spratt, D., “Carbon budgets, climate sensitivity and the myth of ‘burnable carbon'”, Climate Code Red, 8th June, 2014, http://www.climatecodered.org/2014/06/carbon-budgets-climate-sensitivity-and.html

[4] Spratt, D., “The real budgetary emergency and the myth of “burnable carbon”, Climate Code Red, 22nd May, 2014, http://www.climatecodered.org/2014/05/the-real-budgetary-emergency-burnable.html

[5] Cambridge University, “Climate Change: Action, Trends and Implications for Business, The IPCC’s Fifth Assessment Report, Working Group 1“, p.5, http://www.cisl.cam.ac.uk/Resources/Climate-and-Energy/Science-Report.aspam; http://www.europeanclimate.org/documents/IPCCWebGuide.pdf

[6] Spratt, D and Sutton, P, op. cit. p.96

[7] Connor, S, “Vast methane ‘plumes’ seen in Arctic ocean as sea ice retreats”, The Independent, 13 December, 2011, http://www.independent.co.uk/news/science/vast-methane-plumes-seen-in-arctic-ocean-as-sea-ice-retreats-6276278.html

[8] University of Alaska, Fairbanks,Hunting for methane with Katey Walter Anthony, 15th January, 2010, https://www.youtube.com/watch?v=YegdEOSQotE

[9] Moskvitch, K., Mysterious Siberian crater attributed to methane“, Nature, 31st July, 2014, Nature doi:10.1038/nature.2014.15649, http://www.nature.com/news/mysterious-siberian-crater-attributed-to-methane-1.15649

[10] Salter, J., Scientists capture dramatic footage of Arctic glaciers melting in hours, The Telegraph, 20th February, 2009, http://www.telegraph.co.uk/earth/environment/climatechange/4734859/Scientists-capture-dramatic-footage-of-Arctic-glaciers-melting-in-hours.html; and https://www.youtube.com/watch?v=3F9FbdqGRsg

[11] Spratt, D and Sutton, P, op. cit., p. 20.

[12] Hansen, J, “Storms of my Grandchildren”, Bloomsbury, 2009, pp. 255-256 and p. 287. (An alternative ice loss figure to the quoted figure of 250 cubic km from p. 287 had been shown on p. 255 but the correct figure has been confirmed as 250 cubic km in emails of 15th and 16th June, 2011.)

[13] Dunlop, I.,The New Climate Emergency and Risk Management, Presentation at Breakthrough Climate Restoration Forum, 21st June, 2014, http://www.breakthrough2014.org/#!ian/c2048

[14] Raupach, M. R., I.N. Harman and J.G. Canadell (2011) “Global climate goals for temperature, concentrations, emissions and cumulative emissions”,  Report for the Department of Climate Change and Energy Efficiency. CAWCR Technical Report no. 42. Centre for Australian Weather and Climate Research, Melbourne, cited in Spratt, D., 22nd May, 2014, op. cit.

[15] Sutton, P., “A safe climate is still possible, but only if we change the way we campaign”, 14th November, 2013, Version 1d, p.9, http://www.green-innovations.asn.au/RSTI/A-safe-climate-is-still-possible.pdf

[16] Dunlop, I., op. cit.

[17] McKie, R., “‘Incredible’ rate of polar ice loss alarms scientists”, The Guardian, 24th August, 2014, http://www.theguardian.com/environment/2014/aug/24/incredible-polar-ice-loss-cryosat-antarctica-greenland?CMP=twt_gu

Images:

M. Todesco, Cryospheric Processes Laboratory, City College New York City, http://cryocity.org/, used with permission.

The Earth © Pmakin | Dreamstime.com

Commercial airliner flying midair after takeoff © Nils Weymann | Dreamstime.com

????????????????????????????????????????????????????????????????

On 19th August, 2014, The Guardian newspaper published a response by L Hunter Lovins to an earlier article by George Monbiot, in which Monbiot criticised the intensive grazing practices promoted by Allan Savory. [1], [2]

In her response, Lovins referred to the high carbon stores of America’s Great Plains soils and the world’s native grasslands. She said, “They got that way by co-evolving with pre-industrial grazing practices: sufficient herds of native graziers, dense packed by healthy populations of predators.”

As I mentioned in my article Do the math: There are too many cows!, due to human-engineered intensive breeding programs, current livestock populations dwarf those of earlier times. We are not comparing apples with apples when considering past natural grazing practices relative to modern extensive and intensive livestock production systems. [5]

Lovins also cited Polyface farm in the US as evidence that Savory’s approach works. But how successful is Polyface?

In his book CSIRO Perfidy, Geoff Russell reported that the farm (with generous rounding) produces 45 tonnes of food from 60 hectares per year. Russell says, “any plant food or collection of plant foods will wallop the productivity of Polyface”. He indicated that, at the bottom end of the range, an almond farmer could generate 60 tonnes from 60 hectares, for double the protein content of Polyface’s production. [3]

Anyone concerned about obtaining (for example) sufficient protein from plant-based food production may be interested in this table from my article Some thoughts on protein in a plant-based diet [4]:

Figure-1

Another example from Lovins was the Australian company, Sustainable Land Management (SLM). She did not provide a specific example of SLM’s work. However, the company’s website includes the single case study of “Padua“, involving two properties covering 44,000 hectares near Cunnamulla, Queensland. After acquiring the properties in 2012, the company created 200 paddocks by installing 580 kilometres of fencing, along with 98 kilometres of water pipes and 23 new water points.

In my article Livestock and climate: Why Allan Savory is not a saviour, I quoted Gerard Wedderburn-Bisshop, a former Principal Scientist with the Queensland Government Department of Environment and Resources Management Remote Sensing Centre [6]:

Conservation grazing . . . does work in the more temperate regions where rainfall and feed production can support the cost of fencing, but is not a cure-all as is proposed. . . . What Savory does not mention is that intensive (cell) grazing is only viable where water points are close and labour is cheap. Temporary or permanent fencing is labour intensive, moving herds daily requires far more labour input than most operations can afford.”

Wedderburn-Bisshop’s comments regarding “conservation grazing” were based on an article by Associate Professor Ian Lunt of Charles Sturt University, in which he stated, “. . . managed grazing creates an open habitat that is suitable for plants and animals that cannot persist beneath tall, thick grass. This mechanism is only relevant in a small number of Australian ecosystems – particularly lowland grasslands and grassy woodlands on productive soils in areas of moderate to high rainfall. . . . Grazing is not required to maintain diversity in all grassy ecosystems, and is rarely needed in dry, infertile sites where low fertility constrains grass growth.” [7]

Although Savory’s approach may allow revegetation on a relatively small scale, subject to adequate water resources and livestock controls, it would never be sufficient to feed the masses.

Wedderburn-Bisshop has also referred to the “fence line effect” in northern Australia, whereby bare ground will often exist on one side of a fence, while on the other there is knee-high native grass. The bare side will generally be owned by a pastoral company seeking to maximise its financial return. It will have increased stocking rates during times of favourable rainfall, then taken too long to reduce those rates during drought. The land becomes degraded, and carbon stores are significantly depleted. [8]

Lovins seems to have softened the claims of Savory, in that she talks of his practices “countering” climate change, rather than “reversing” it. I wonder if she believes that Savory has overstated the potential benefits of his methods, and is subtly stepping away from his most elaborate claim.

Savory and his supporters, including Lovins, may be akin to those who support fossil fuels in relation to climate change, promoting methods such as carbon capture and storage. Their approaches tweak systems that are fundamentally flawed, when far more simple and effective solutions are readily available.

Author: Paul Mahony (also on on Twitter, Slideshare and Scribd)

Note: Protein chart updated 21st February, 2016.

[1] Lovins, L. Hunter, Why George Monbiot is wrong: grazing livestock can save the world, The Guardian, 19th August, 2014, http://www.theguardian.com/sustainable-business/2014/aug/19/grazing-livestock-climate-change-george-monbiot-allan-savory?

[2] Monbiot, G.,Eat more meat and save the world: the latest implausible farming miracle, The Guardian, 4th August, 2014, http://www.theguardian.com/environment/georgemonbiot/2014/aug/04/eat-more-meat-and-save-the-world-the-latest-implausible-farming-miracle

[3] Russell, G., CSIRO Perfidy, Vivid Publishing, 2009, http://www.perfidy.com.au/

[4] Mahony, P., Some thoughts on protein in a plant-based diet, Terrastendo, 27th March, 2014, https://terrastendo.net/2014/03/17/some-thoughts-on-protein-in-a-plant-based-diet/

[5] Mahony, P., Do the math: There are too many cows!, Terrastendo, 26th July, 2013, https://terrastendo.net/2013/07/26/do-the-math-there-are-too-many-cows/

[6] Mahony, P.,Livestock and climate: Why Allan Savory is not a saviour, Terrastendo, 26th March, 2013, https://terrastendo.net/2013/03/26/livestock-and-climate-why-allan-savory-is-not-a-saviour/

[7] Lunt, I., Can livestock grazing benefit biodiversity?, The Conversation, 19th November, 2012, http://theconversation.edu.au/can-livestock-grazing-benefit-biodiversity-10789, citing Lunt, I., Eldridge, D.J., Morgan, J.W., Witt, G.B., Turner Review No. 13 – A framework to predict the effects of livestock grazing and grazing exclusion on conservation values in natural ecosystems in Australia“, Australian Journal of Botany 55(4) 401–415, http://dx.doi.org/10.1071/BT06178 and http://www.publish.csiro.au/paper/BT06178

[8] Mahony, P., Omissions of Emissions: A Critical Climate Change Issue, Terrastendo, 9th February, 2013, https://terrastendo.net/2013/02/09/omissions-of-emissions-a-critical-climate-change-issue/

Image: Cattle after Sunset © Joaobambu | Dreamstime.com


??????????????????????????????????????????????????????????????????

In March and July, 2013, I posted articles on Allan Savory and Bill McKibben. I subsequently added a number of postcripts. Here’s another, posted as a stand-alone article.

If you don’t know of them, Savory promotes intensive livestock grazing systems, and McKibben is the founder of climate change campaign group, 350.org.

I was prompted to post this article by a high-profile critique of Savory’s work by Guardian columnist, George Monbiot, published on 4th August, 2014. (Monbiot covered much of the material that I had referred to in my own article.)

I was criticising Savory for the lack of scientific evidence to support claims that his form of intensive livestock grazing could reverse climate change and prevent desertification. I was similarly critical of McKibben for his lack of evidence and detail in promoting intensively grazed systems.

McKibben was supporting Savory’s approach during a 2013 visit to Australia. He also seemed to be doing so in a 2010 article in Orion Magazine, but did not specifically refer to Savory at that time.

Some time back, I became aware that supporters of Savory appear to have taken credit for much of the material used in McKibben’s article. They did so in an April, 2010 discussion within the Soil Age Google Group.

The discussion included or referred to Adam Sacks, Seth Itzkan and Jim Laurie. You can see them pictured with Savory on the Savory Institute Hubs page.

A note from Itzkan to Sacks within the Google Group discussion indicated the extent to which group members and/or acquaintances had assisted McKibben:

This article is a direct result of your [Sacks’s] interaction with him and the subsequent correspondences that you, me, and Jim [Laurie] had with him in the following weeks, both the general theme, as well as the particulars and specifically all the language about electric fences, dung beetles, predators, and of course ‘methane-loving bacteria’.  He was profoundly influenced, and grateful for our influence, and I’m thankful to you for helping to make that connection.

As explained in my article on McKibben, the research on “methane loving bacteria” that Sacks referred to in a January, 2010 Grist article was subsequently found to be out by a factor of 1,000. A seemingly inadvertent error had occurred in reporting milligrams instead of micrograms.

I’m not aware of McKibben, Orion Magazine, Sacks or Grist correcting the articles. If they have not, then perhaps they should, particularly on such a critical issue.

Author: Paul Mahony (also on Twitter, Slideshare and Sribd)

References:

Mahony, P., Livestock and climate: Why Allan Savory is not a saviour”, Terrastendo, 26 Mar, 2013, https://terrastendo.net/2013/03/26/livestock-and-climate-why-allan-savory-is-not-a-saviour/

Mahony, P., Do the math: There are too many cows!, Terrastendo, 26th July, 2013, https://terrastendo.net/2013/07/26/do-the-math-there-are-too-many-cows/

Monbiot, G., Eat more meat and save the world: the latest implausible farming miracle, The Guardian, 4th August, 2014, http://www.theguardian.com/environment/georgemonbiot/2014/aug/04/eat-more-meat-and-save-the-world-the-latest-implausible-farming-miracle?CMP=fb_gu

McKibben, Bill, The only way to have a cow, Orion Magazine, Mar/Apr 2010, http://www.orionmagazine.org/index.php/articles/article/5339/

Sacks, A., The Climate Solution: Got Cows?”, Grist, 31 Jan, 2010, http://grist.org/article/the-climate-solution-got-cows/

Image: Cattle at sunset © Anthony Brown | Dreamstime.com


AntarcticaTemps_1957-2006

New research published in Geophysical Research Letters helps “explain the mechanism that is causing the rapid melting of the West Antarctic glaciers now being observed”. [1, 2]

However, according to the study’s lead author, Paul Spence of the University of New South Wales (UNSW), recent studies [3] suggesting the glaciers may have begun an irreversible melting “may prove optimistic because models had failed to account for how strengthening westerly winds in the Southern Ocean would start to impinge coastal easterlies, upsetting a delicate balance of warm and cold waters close to the Antarctic ice sheets”.

The research found that the coastal temperature structure of Antarctica was more sensitive to global warming, particularly changes to winds, than previously identified, leading to warm offshore water flooding into the ice-shelf regions and increasing the temperatures by 4 degrees Celsius under the ice shelf.

This research is additional to a study from May, 2014, which found that westerly winds in the Southern Ocean had quickened 10-15 percent over the past 50 years, and shifted 2 to 5 degrees closer to the South Pole. A co-author of that study, Matthew England of UNSW, was also a co-author of the latest report. The study had found that, in addition to the ozone hole over Antarctica, greenhouse gas emissions were contributing to the changing winds.[4]

The research highlights the rapidly changing nature of factors affecting climate change. Even before considering such developments, it is important to note that findings and projections from the Intergovernmental Panel on Climate Change (IPCC) are extremely conservative. Factors omitted from IPCC projections include the release of carbon from melting permafrost (frozen soil) around the Arctic and the dynamics of ice sheet loss on Greenland and Antarctica. Former Australian of the Year and head of the Climate Council, Professor Tim Flannery, has described IPCC reports as “painfully conservative”. [5]

Former head of NASA’s Goddard Institute for Space Studies, Dr James Hansen, has said that the IPCC treats sea level change basically as a linear process. He argues that it is more realistic that ice sheet disintegration will be non-linear, which is typical of a system that can collapse. [6]

Another concern is that, due to the time lag involved in producing reports, IPCC projections are generally out of date before they are published.

Commenting on the latest research, Tas van Ommen, a principal research scientist at the Australian Antarctic Division, has said: “Even 10 centimetres [4 inches] of sea-level rise tripled the flooding frequency of the world’s coastal regions.” [7]

With the increased likelihood and consequences of extreme events arising from climate change, governments, corporations and others need to consider and plan for a broad range of scenarios that go beyond the factors allowed for by the IPCC .

Author: Paul Mahony (also on SlideshareScribd, and Twitter)

References:

[1] Spence, P., Griffies, S.M., England, M.H., Hogg, A.M., Saenko, O.A., Jourdain, N.C., Geophysical Research Letters, “Rapid subsurface warming and circulation changes of Antarctic coastal waters by poleward shifting winds”, doi: 10.1002/2014GL060613, July, 2014, http://iopscience.iop.org/1748-9326/2/2/024002/fulltext/

[2] Hannam, P., “Bad news for sea-level rises as quickening Antarctic winds point to faster ice melt”, Sydney Morning Herald, 8th July, 2014, http://www.smh.com.au/environment/climate-change/bad-news-for-sealevel-rises-as-quickening-antarctic-winds-point-to-faster-ice-melt-20140707-zsz3o.html

[3] Rignot, E., Mouginot, J., Morlighem, M., Seroussi, H. and Scheuchl, B., “Widespread, rapid grounding line retreat of Pine Island, Thwaites, Smith, and Kohler glaciers, West Antarctica, from 1992 to 2011“, Geophysical Research Letters, Published online: 27 May, 2014, DOI: 10.1002/2014GL060140, Volume 41, Issue 10, pages 3502–3509, 28 May 2014, cited in Phillips, A., NASA Science “Science News”, “West Antarctic Glaciers in Irreversible Decline”, 12 May, 2014, http://science.nasa.gov/science-news/science-at-nasa/2014/12may_noturningback/

[4] Abram, N.J., Mulvaney, R., Vimeux, F., Phipps, S.J., Turner, J., England, M.H., “Evolution of the Southern Annular Mode during the past millennium”, Nature Climate Change, Volume: 4, Pages: 564–569, DOI: doi:10.1038/nclimate2235, published online 11th May, 2014, http://www.nature.com/nclimate/journal/v4/n7/full/nclimate2235.html

[5] Spratt, D, “Global Warming – No more business as usual: This is an emergency!”, Environmental Activists’ Conference 2008: Climate Emergency – No More Business as Usual, 10 October, 2008, reproduced in Links International Journal of Socialist Renewal, http://links.org.au/node/683

[6] Hansen, J., “Storms of my granchildren”, Bloomsbury, 2009, pp. 255-256.

[7] Hannam, P. op. cit.

Image: NASA Earth Observatory, Antarctic Warming Trends from 1957 to 2006, 23 Jan 2009, http://earthobservatory.nasa.gov/IOTD/view.php?id=36736

Related Presentation:Risk Management, Insurance and the Climate Crisis

Chicken-Meat-Production-detailed-2-resized-sharpened

1,048.

That’s the number of chickens killed for human consumption.

Per minute.

In Australia.

In 2011/12.

That’s over 1.5 million per day.

That’s 551 million for the year.

4.5 percent of chicken meat was exported.

That left the equivalent of 526 million chickens.

To feed (at that time) around 22 million people.

That’s 24 chickens for every man, woman and child.

The industry predicts that the number will increase to 628 million in 2015/16.

Figure 1: Chicken meat production in Australia

Chicken-Meat-Production-detailed-2-resized

That’s nearly 1,200 per minute.

That’s bizarre.

And obscene.

Chickens are beautiful and intelligent animals.

Not that beauty and intelligence should determine whether or not an animal is killed for food.

There is no need.

Apart from the slaughter process, chickens grown for meat suffer immense cruelty during their short lives.

Here’s a short clip of a sanctuary hen teaching and protecting her chick.

If you care to watch, perhaps think of a human mother teaching and protecting her young child.

Chickens and other animals used for food deserve much better than the horrendous lives we impose upon them. They are not here to serve humans.

Besides, by channeling grains through animals who are then killed to be eaten, we are causing other humans to starve due to the waste involved in an inherently inefficient system. The Food and Agriculture Organization of the United Nations reported in 2013 that 842 million people in 2011-13 were estimated to be suffering from chronic hunger.

After allowing for yield, 2.35 kilograms of grain needs to be fed to chickens to produce 1 kilogram of chicken meat. That’s equivalent to a loss of 57 percent.

The Australian Chicken Meat Federation has reported that chicken feed generally comprises 85-90 percent grains, such as wheat, sorghum, barley, oats, lupins, soybean meal, canola and other oilseed meals and grain legumes. The balance consists mainly of meat and bone meal and tallow.

We are also contributing massively to climate change and other environmental problems by causing far more resources (including land and fertiliser) to be used than would otherwise be required. As I have reported elsewhere, the greenhouse gas emissions intensity of chicken meat is many times that of plant-based alternatives of comparable nutritional value.

Bad for chickens.

Bad for people.

Bad for the planet.

If you haven’t done so already, isn’t it time to change?

Author: Paul Mahony (also on SlideshareScribd, and Twitter)

References:

Department of Agriculture, Fisheries and Forestry, “Australian Food Statistics 2011/12”, Table 2.4, Supply and use of Australian meats, http://www.daff.gov.au/__data/assets/pdf_file/0007/2269762/daff-foodstats-2011-12.pdf

Chicken’s feed conversion figure: Australian Chicken Meat Federation, Industry facts and figures, “Production Efficiency”, http://www.chicken.org.au/page.php?id=4 (accessed 7th May, 2014).

Chicken meat yield from live weight: United States Department of Agriculture Economic Research Service, “Agricultural Handbook No. 697”, June, 1992 (website updated 10 September, 2013), “Weights, Measures, and Conversion Factors for Agricultural Commodities and Their Products”, http://www.ers.usda.gov/publications/ah-agricultural-handbook/ah697.aspx#.U0ihR6Ikykw

Animals Australia “Broiler Chicken Fact Sheet”, http://www.animalsaustralia.org/factsheets/broiler_chickens.php (accessed 31 May, 2014)

Australian Chicken Meat Federation, “Growing Meat Chickens – Feed”, http://www.chicken.org.au/page.php?id=6#Feed (accessed 31 May, 2014)

Mahony, P., “The Electric Cow”, 27 May, 2014, https://terrastendo.net/2014/05/27/the-electric-cow/

Food and Agriculture Organization of the United Nations, “The State of Food Insecurity in the World 2013 “, http://www.fao.org/publications/sofi/en/

Images:

Main image created by author.

Chicken meat production chart: Australian Chicken Meat Federation, Industry Facts and Figures, Chicken Meat Production in Australia, http://www.chicken.org.au/page.php?id=4 (accessed 31 May, 2014)

Video:

Exerpt from “Peaceable Kingdom – the journey home” by Tribe of Heart, 2009, http://www.peaceablekingdomfilm.org/

Postscript 2nd June, 2014: Globally in 2011, we killed a staggering 110,000 chickens per minute for human consumption, or 58 billion in total. That’s around 105 times the number killed in Australia. Here is a list of slaughter numbers by animal, from the Food and Agriculture Organization of the United Nations.


Electric-Cow

Most climate change campaigners focus on the fossil fuel sector.

While it’s essential that we move away from fossil fuels if we’re to avoid an ongoing climate catastrophe, we must also move away from animal agriculture.

The concept of the electric cow aims at providing some context to livestock’s greenhouse gas emissions by comparing such emissions to those of: (a) electricity generated by fossil fuels; and (b) aluminium smelting, the end product of which is known within the industry as “congealed electricity” due to its enormous energy requirements.

Here are some questions from the slideshow that’s included below:

“If cows ran on electricity, how much would we use in order to satisfy a nation’s demand for meat?”

“Specifically, what figure would we arrive at if it was based on their current level of greenhouse gas emissions?”

The answer is that, if cows and other farm animals ran on electricity instead of food, water and oxygen, and greenhouse gas emissions were used to measure usage, then our current level of electricity generation would be insufficient to supply Australia’s current food mix, even if we ceased using electricity for other purposes.

Textbox-sharpened

That’s in a country that relies primarily on coal-fired power and is one of the highest per capita emitters in the developed world.

If your daily food intake includes a 200 gram steak (less than half a pound) from a grass-fed cow, you may be generating around 60 kilograms of greenhouse gas. If you replace the steak with (for example) kidney beans, tofu and soy nuts (dried soy beans), you’ll get plenty of protein and produce less than 3 kilograms of greenhouse gas.

While it’s true that carbon dioxide from the burning of fossil fuels will remain in the atmosphere for much longer than methane belched by cows and sheep, methane’s shorter-term impacts can become long-term to the extent that they contribute to us reaching climate change tipping points with catastrophic and irreversible consequences.

Land clearing is also a critical factor, resulting largely from livestock’s inherent and gross inefficiency as a food source, with the need to use far more resources, including land, than would be required if we generally adopted a plant-based diet.

Here’s the slideshow, followed by some details on Australia’s livestock-related methane emissions compared to those from its electricity generation.

http://www.slideshare.net/paulmahony101/the-electric-cow

x

Further details

Nearly 90 per cent of Australia’s electricity is generated from traditional fossil fuels, with 69 per cent from coal and 19 per cent from natural gas. [i]  To provide some context, in terms of gross domestic product, Australia’s economy was ranked number 12 of 214 nations by The World Bank as at 8th May, 2014.[ii]

Figure 1: Australian electricity generation, by fuel type

Figure-1

Applying a 100-year “global warming potential” (GWP), Australia’s 2012 National Greenhouse Inventory reported 57.9 megatonnes of CO2-equivalent (CO2-e) methane emissions from livestock production.[iii] Assuming that 57 per cent of savanna burning was livestock related (the figure utilised in a 2003 report commissioned by the Australian Greenhouse Office), the figure increases to 62.7 megatonnes.[iv] That equates to 215 megatonnes of CO2-e emissions using a 20-year GWP, which is more than the emissions from all electricity generation.[v] A similar approach was utilised in a 2007 article in Australasian Science titled “Meat’s Carbon Hoofprint”.[vi]

I have used the IPCC’s 20-year GWP for methane of 86 (including climate carbon feedbacks). That is a conservative figure relative to NASA’s estimate of 105.

Figure 2: Kilotonnes (gigagrams) of greenhouse gas emissions from electricity production and methane-related emissions from livestock (20-year GWP for methane)

Figure-2

The analysis shows that, even before allowing for factors such as land-clearing and nitrous oxide emissions from manure management, the emissions from animal agriculture in Australia are more than those from electricity generation, most of which is coal-fired.

Blog author

Paul Mahony

Note

This is post was updated on 9th July, 2014 and 15th October, 2015. The 2015 update comprised the inclusion of the material under “Further details”.

References

[i]       Australian Government, Bureau of Resources and Energy Economics, “2013 Australian Energy Update”, Fig. 3 Australian electricity generation, by fuel type, p. 10, and Table 8, page 11, http://www.bree.gov.au/sites/bree.gov.au/files/files//publications/aes/2013-australian-energy-statistics.pdf and http://www.bree.gov.au/publications/australian-energy-statistics

[ii]      The World Bank, GDP Ranking, 8th May, 2014, http://data.worldbank.org/data-catalog/GDP-ranking-table

[iii]     Australian Government, Dept of the Environment, “National Inventory Report 2012 Volume 1”, Table 6.1 Agriculture sector CO2-e emissions, 2012, p. 257, http://www.environment.gov.au/system/files/resources/6b894230-f15f-4a69-a50c-5577fecc8bc2/files/national-inventory-report-2012-vol1.pdf (The precise figure is 57.892 tonnes.)

[iv]      George Wilkenfeld & Associates Pty Ltd and Energy Strategies, National Greenhouse Gas Inventory 1990, 1995, 1999, End Use Allocation of Emissions Report to the Australian Greenhouse Office, 2003, Volume 1, Table 5.2, p. 83

[v]      Australian Government, Dept of the Environment, op. cit., Figure 3.2: CO2-e emissions from electricity generation by fossil fuels, 1990–2012, p. 50.

[vi]      Brook, Prof. Barry and Russell, Geoff, “Meat’s Carbon Hoofprint”, Australasian Science, Nov/Dec 2007, pp. 37-39, http://www.control.com.au/bi2007/2810Brook.pdf

Images

Plug © Antonio Mirabile | Dreamstime.com
Cow © Pavelmidi1968 | Dreamstime.com


????????????????????????????????????????????????????????????????????????????????????????

Despite what many of those who advocate meat-eating would like to believe, humans do not sit at the top of the food chain. In any event, it’s a food web rather than a chain, due to the many complex interactions involved.

An article commenting on our position in the food web was published in the Proceedings of the National Academy of Sciences (PNAS) in late 2013. [1]

According to the head of the research team, Sylvain Bonhommeau of the French Research Institute for Exploitation of the Sea in Sète, “We are closer to herbivore than carnivore. . . . It changes the preconception of being top predator.” [2]

The article considered the trophic level of different species and nations. Trophic levels “represent a synthetic metric of species’ diet, which describe the composition of food consumed and enables comparisons of diets between species”.

A species’ trophic level is calculated as the average of trophic levels of food items in its diet, weighted by quantity, plus one.

If an animal were to eat nothing but cows, its trophic level would be 3, calculated as the sum of 2 (the cow’s trophic level as referred to below) and 1. The trophic level of another animal that were to only eat that animal would be 4, and so on.

Plants and other “primary producers”, such as phytoplankton, have a trophic level of 1. A species that consumes only plants, such as a cow or elephant, has a trophic level of 2.  The trophic level of apex predators, such as polar bears and killer whales is 5.5.

The researchers reported that the global median human trophic level (HTL) in 2009 was 2.21, representing a 3 percent increase since 1961. The authors said, “In the global food web, we discover that humans are similar to anchovy or pigs and cannot be considered apex predators”.

Here’s how the rankings of a few species can be depicted, without attempting to display the complex interactions involved:

Figure 1: Some examples of trophic levels

Trophic-levels-6-sharpened

A major concern in terms of the environment and the rights of animals is the increasing overall human trophic level, driven largely by growing levels of meat consumption in China and India. The authors stated, “With economic growth, these countries are gaining the ability to support the human preference for high meat diets”.

Figure 2: Trends in human trophic level (1961-2009)web2-Figure1A

Since 1960, we have seen a reduction in the percentage of plants in the human diet and a corresponding increase in the percentage of terrestrial and marine animals.

Figure 3: Percentage of plants and animals in the human diet

Percentage-plants

Percentage-terrestrial-animals

Percentage-marine-animals

Some climate change implications

Animal agriculture is a key contributor to increasing concentrations of greenhouse gases such as carbon dioxide, methane and nitrous oxide.  Land clearing for livestock grazing and feedcrop production, in addition to releasing massive amounts of carbon, has reduced the biosphere’s ability to draw down existing carbon. According to leading climate scientist, Dr James Hansen, we must reduce atmospheric concentrations of carbon dioxide to around 350 ppm (parts per million) if we are to overcome the threat of climate change. Massive reforestation and restoration of soil carbon is required in order to achieve that target. [3] In April, 2014, carbon dioxide concentrations reached 401.9 ppm. [4]

It seems ironic that China is contributing to the problem by increasing its meat consumption. The Chinese leadership would surely understand the extreme dangers posed by climate change, including a potential loss of dry-season water flows into key river systems due to the potential loss of glaciers.

Climate change author, David Spratt, has stated [5]:

“Taken together with those on the neighbouring Tibetan plateau, the Himalayan–Hindu Kush glaciers represent the largest body of ice on the planet outside the polar regions, feeding Asia’s great river systems, including the Indus, Ganges, Brahmaputra, Salween, Mekong, Yangtze and Huang He. The basins of these rivers are home to over a billion people from Pakistan to China. The Himalayas supply as much as 70 per cent of the summer flow in the Ganges and 50–60 per cent of the dry-season flow in other major rivers. In China, 23 per cent of the population lives in the western regions, where glacial melt provides the principal dry season water source. The implications of the loss of the Himalayan ice sheet are global and mind numbing, but such a calamity rarely rates a mention in Australia.”

Australia seems happy to help China to satisfy its growing taste for red meat by expanding its exports. [6]

The existence of critical environmental externalities in beef production means that the Chinese and other consumers of Australian meat are paying a fraction of the product’s true cost.

Meanwhile, the Chinese maintain a population of nearly 500 million pigs, which is just under half the global population. [7]. Those pigs consume enormous amounts of soy from overseas, including soy grown in the Amazon and Cerrado regions of South America. Both regions contain massive stores of carbon, which are released through land clearing for feedcrop production (including soy) and livestock grazing. [8]

Figure 4: Soybean Production, Consumption and Imports in China 1964-2011

Chinese-soybean

China’s projected soy bean imports for 2014/15 are 72 million tonnes. The second-ranked importer is the European Union, with 12.5 million tonnes. [9]

With domestic production of 12 million tonnes, China’s total consumption in 2014/15 is 84 million tonnes, up from approximately 70 million tonnes in 2011 (including imports of 59 million tonnes).

Only around 10 percent of the soybeans used in China are consumed directly as food by humans. The other 90 percent are crushed, separating the oil and meal, with the latter widely used in animal feed rations. [8]

Some health implications

The PNAS paper categorised countries into five groups:

  1. Low and stable HTLs (majority of sub-Saharan countries and most of Southeast Asia)
  2. Low and increasing HTLs (several countries throughout Asia, Africa, and South America, including China and India)
  3. Higher initial HTLs than group 2, with an increasing trend (Central America, Brazil, Chile, Southern Europe, several African countries and Japan)
  4. High and stable HTLs until around 1990, when they began to decrease (North America, Northern and Eastern Europe, Australia, and New Zealand)
  5. The highest overall HTLs and decreasing trends (Iceland, Scandinavia, Mongolia, and Mauritania)

Health concerns have been a key driver of HTL reductions in countries within Groups 4 and 5.

In Group 4, “the nutrition transition has reached a point where health problems associated with high fat and meat diets (i.e., high HTLs) have led to changes in policy and government-run education programs that encourage these populations to shift to more plant-based diets”.

The reductions in HTLs within Scandinavian countries (Group 5) “is due to government policies promoting healthier diets”.

Rising meat consumption in China and India is likely to lead to a marked increase in rates of diseases and conditions such as heart disease, certain cancers, obesity and diabetes. [10]

According to the American Dietetic Association, well-planned plant-based diets are appropriate for individuals during all stages of the life cycle. [11]

As such, the world’s human population could aim for a trophic level of 2, with critical environmental and health benefits, not to mention the reduction in animal exploitation and cruelty.

For Australian and New Zealand readers, you should be aware that The Medical Journal of Australia has reported: “In contrast to the United States . . .  Food Standards Australia New Zealand permits only a limited number of foods to be fortified with vitamin B12. This includes selected soy milks, yeast spread, and vegetarian meat analogues such as soy-based burgers and sausages.” [12] Vitamin B12 was once more readily available than at present to those on a plant-based diet without fortification or supplementation, in a manner that was far more natural than the forced breeding practices and ecosystem destruction that characterise the animal agriculture sector, past and present. [13]

and have previously written, in relation to B12, that (a) destroying rainforests and other natural environs; and (b) operating industrial farming systems; purely for animal food products, is hardly natural. Sadly, in Australia, fortification of food products is not permitted to the same extent as in the USA. The Medical Journal of Australia has reported: “In contrast to the United States, where foods are extensively fortified with vitamin B12, Food Standards Australia New Zealand permits only a limited number of foods to be fortified with vitamin B12. This includes selected soy milks, yeast spread, and vegetarian meat analogues such as soy-based burgers and sausages.” (Zeuschner, C.L. et al., “Vitamin B12 and vegetarian diets”, MJA Open 2012; 1 Suppl 2: 27-32, 4 June 2012, https://www.mja.com.au/open/2012/1/2/vitamin-b12-and-vegetarian-diets) – See more at: http://freefromharm.org/health-nutrition/b12-magic-pill-veganisms-achilles-heel/#sthash.8N41mRvm.dpuf
I agree completely with your comments on the question of what is natural, and have previously written, in relation to B12, that (a) destroying rainforests and other natural environs; and (b) operating industrial farming systems; purely for animal food products, is hardly natural. Sadly, in Australia, fortification of food products is not permitted to the same extent as in the USA. The Medical Journal of Australia has reported: “In contrast to the United States, where foods are extensively fortified with vitamin B12, Food Standards Australia New Zealand permits only a limited number of foods to be fortified with vitamin B12. This includes selected soy milks, yeast spread, and vegetarian meat analogues such as soy-based burgers and sausages.” (Zeuschner, C.L. et al., “Vitamin B12 and vegetarian diets”, MJA Open 2012; 1 Suppl 2: 27-32, 4 June 2012, https://www.mja.com.au/open/2012/1/2/vitamin-b12-and-vegetarian-diets) – See more at: http://freefromharm.org/health-nutrition/b12-magic-pill-veganisms-achilles-heel/#sthash.8N41mRvm.dpuf

Conclusion

Overall global livestock production is proceeding at unsustainable levels, with no sign of slowing down. If we wish to retain a habitable planet, we must urgently address the issue of diet in addition to fossil fuels.

The time to act is now!

Footnote: None of the material contained in this article should be construed as representing medical, health, nutritional, dietary or similar advice.

Author: Paul Mahony (also on Twitter, Slideshare, and Scribd).

References:

[1] Bonhommeau, S., Dubroca, L., Le Pape, O., Barde, J., Kaplan, D.M., Chassot, E., Nieblas, A.E., “Eating up the world’s food web and the human trophic level”, Proc. Natl Acad. Sci. USA http://www.pnas.org/cgi/doi/10.1073/pnas.1305827110 (2013)

[2] Hoag, H., “Humans are becoming more carnivorous”, Nature, 2nd Dec, 2013,  doi:10.1038/nature.2013.14282, http://www.nature.com/news/humans-are-becoming-more-carnivorous-1.14282

[3] Hansen, J; Sato, M; Kharecha, P; Beerling, D; Berner, R; Masson-Delmotte, V; Pagani, M; Raymo, M; Royer, D.L.; and Zachos, J.C. “Target Atmospheric CO2: Where Should Humanity Aim?”, 2008. http://www.columbia.edu/~jeh1/2008/TargetCO2_20080407.pdf

[4] Earth System Research Laboratory, Global Monitoring Division, Up-to-date weekly average CO2 at Mauna Loa, Week beginning on May 4, 2014 (401.9 ppm), http://www.esrl.noaa.gov/gmd/ccgg/trends/weekly.html

[5] David Spratt,“Global Warming – No more business as usual: This is an emergency!”, Environmental Activists’ Conference 2008: Climate Emergency – No More Business as Usual, 10 October, 2008, reproduced in Links International Journal of Socialist Renewal, http://links.org.au/node/683

[6] Binsted, T., “Australia poised to benefit from China’s beef demand”, The Age, 24 April, 2014, http://www.theage.com.au/business/australia-poised-to-benefit-from-chinas-beef-demand-20140424-375pt.html

[7] FAOSTAT, Live Animals, 2012, http://faostat.fao.org/site/573/DesktopDefault.aspx?PageID=573#ancor, accessed 12 May, 2014. (Actual number: 471,875,000 of a global population of 966,170,968)

[8] Brown, L.R., “Full Planet, Empty Plates: The New Geopolitics of Food Scarcity, Chapter 9, China and the Soybean Challenge”, Earth Policy Institute, 6 November, 2013, http://www.earthpolicy.org/books/fpep/fpepch9

[9] United States Department of Agriculture Foreign Agricultural Service Approved by the World Agricultural Outlook Board/USDA Circular Series, “Oilseeds: World Markets and Trade”, May 2014, http://apps.fas.usda.gov/psdonline/circulars/oilseeds.pdf

[10] Mahony, P., “If you thinks it’s healthy to eat animals, perhaps you should think again”, 12th February, 2013, https://terrastendo.net/2013/02/12/if-you-think-its-healthy-to-eat-animals-perhaps-you-should-think-again/

[11] Craig, W.J., Mangels, A.R., American Dietetic Association, “Position of the American Dietetic Association: vegetarian diets.”, J Am Diet Assoc. 2009 Jul;109(7):1266-82, http://www.ncbi.nlm.nih.gov/pubmed/19562864

[12] Zeuschner, C.L. et al., “Vitamin B12 and vegetarian diets”, MJA Open 2012; 1 Suppl 2: 27-32, 4 June 2012, https://www.mja.com.au/open/2012/1/2/vitamin-b12-and-vegetarian-diets

[13] Capps, A., “B12: A Magic Pill, or Veganism’s Achilles Heel?”, Free from Harm, 11 April, 2014, http://freefromharm.org/health-nutrition/b12-magic-pill-veganisms-achilles-heel/

Figures:

Figure 1 – Prepared by author

Figure 2 – Bonhommeau, S. et al., op. cit., Figure 1 (A)

Figure 3 – ibid., Supporting Information, Figure 4

Figure 4 – Brown, L.R., op. cit., Figure 9–1 based on data from USDA, Production, Supply, and Distribution, electronic database, at www.fas.usda.gov/psdonline, updated 10 May 2012; D. H. Baker, “D.E. (Gene) Becker and the Evolution of the Corn-Soybean Meal Diet for Pigs,” Illinois Swine Research Reports (2003), pp. 101-04; Jack Cook, An Introduction to Hog Feeding Spreads (Chicago: Chicago Mercantile Exchange, 2009), p. 3.

Main Image: Animal Polar Bear © Pilipenko | Dreamstime.com

??????????????????????????????????????????????????????????????????????????????

There are many myths about meat consumption. I focus on two in this article, along with some related issues.

MYTH 1: BEEF PRODUCED FROM GRASS-FED COWS IS BETTER FOR THE ENVIRONMENT THAN GRAIN-FED

It seems logical, doesn’t it? After all, eating grass is natural for a cow. But does that make it better for the environment?

Why wouldn’t you believe the myth when a supposedly authoritative source like the Australian Conservation Foundation says: “When you do buy meat, choose pasture or grass-fed sources over grain-fed ones.” [1]

To my knowledge, the ACF has not cited any sources to support that statement.

Similarly, no sources were cited by prominent climate change activist Bill McKibben of 350.org when he supported the idea of grass-fed cattle over the feedlot variety in his Orion Magazine article of 2010, The Only Way to Have a Cow“. [2] He was maintaining that position during a speaking tour of Australia in June, 2013. [Footnote 1]

Emissions from grass-fed cows are multiples of the grain-fed alternative

On the other hand, Professor Gidon Eshel of Bard College, Annandale-on-Hudson, New York and formerly of the Department of the Geophysical Sciences, University of Chicago, has reported, “since grazing animals eat mostly cellulose-rich roughage while their feedlot counterparts eat mostly simple sugars whose digestion requires no rumination, the grazing animals emit two to four times as much methane”. [3]

In Australia, the CSIRO (Commonwealth Scientific and Industrial Research Organisation) has also reported that cows produce significantly more methane when eating grass than when eating grain. It stated, “These measurements clearly document higher CH4 [methane] production (about four times) for cattle receiving low-quality, high-fiber diets than for cattle fed high-grain diets.” [4]

CSIRO scientists subsequently reported some reduction in methane emissions from northern Australian cattle herds, representing around half the country’s cattle population. [5] However, that would still leave grass-fed cows’ methane emissions as a multiple of grain-fed emissions.

What does the FAO say?

In November, 2013, the FAO (Food and Agriculture Organization of the United Nations) reported a signficant difference in the greenhouse gas emissions intensity between beef derived from animals on “grazing” (or “grass-based”) feeding systems and those on “mixed” systems. [6] [7]

The emissions intensity of a product represents the kilograms of CO2-equivalent (CO2-e) greenhouse gas emissions per kilogram of product.

It seems reasonable to conclude that the FAO’s “mixed” figures included grain-fed cattle, as it confirmed “grass-based and mixed livestock production systems” are responsible for 100 percent of global beef production. (Reference 7, p. 24).

Cows are not fed grain exclusively. They have not evolved to consume it, and if it is used at all, they are generally only “finished” on it for the final one hundred days or so prior to slaughter.

For specialised beef (as opposed to beef from dairy cows), the FAO reported emissions intensity figures of 56.2 for mixed feeding systems and 102.2 from grazing systems.

Those figures were based on carcass weight. If we gross them up to allow for the fact that not all the carcass is used as end product for the dinner table, the figures increase to 77.2 and 140.2 respectively. That’s based on the US Department of Agriculture’s mid-range yield estimate of 72.8% for all beef, including ground beef for use in hamburgers and the like. [8]

We can also gross them up to allow for a 20-year GWP (global warming potential) for methane. Allowing for that factor (refer to additional comments below), the figures increase to 160.1 and 290.9 respectively.

Conventional measures of methane’s global warming impact measure it over a 100-year timeframe. However, methane breaks down relatively quickly in the atmosphere, with much of it doing so within around 12 years. That means the 100-year measure greatly understates its shorter-term impact, as it provides an average figure over a 100-year period, when much of the methane effectively did not exist during the final 88 years. In the chart below, I have used a 20-year GWP of 86 for methane, from the IPCC’s Fifth Assessment Report. It is up from the IPCC’s previous figure of 72, and allows for carbon-climate feedbacks. (Without those feedbacks, the IPCC now uses a figure of 84.) [9]

Researchers at NASA have estimated an even higher 20-year GWP for methane of 105. [10]

Although methane may have a shorter life than carbon dioxide (which remains in the atmosphere for many hundreds of years), its impact can be long-term if it contributes to us reaching tipping points that result in positive feedback loops with potentially irreversible and catastrophic consequences. On the positive side, the relatively short-term nature of methane’s impact means that action on livestock production can be one of the most effective steps available to us in dealing with climate change.

Respected climate change commentator, Joseph Romm, has quoted the IPCC [his underlines]:

There is no scientific argument for selecting 100 years compared with other choices (Fuglestvedt et al., 2003; Shine, 2009). The choice of time horizon is a value judgement since it depends on the relative weight assigned to effects at different times.” [11]

Romm went on to say:

“Given that we are approaching real, irreversible tipping points in the climate system, climate studies should, at the very least, include analyses that use this 20-year time horizon.”

I have previously compared beef production to aluminium in order to add some perspective to its emission levels. Aluminium production is an incredibly emissions-intensive process.  In recent times, it has consumed up to 16 percent of Australia’s electricity production [12], for less than: 1 percent of GDP (gross domestic product); and 0.1 percent of jobs.

In a 2003 report commissioned by the former Australian Greenhouse Office, its emissions intensity was reported as 20 kg CO2-e per kg of product. [13] The Australian Aluminium Council has reported a 2011 figure of 15.6 kg (rounded to 16 kg in the table below) for “primary aluminium production, not including emissions from alumina refining which are considered separately”.  [14] It has stated that over 80 percent of smelting’s greenhouse gas emissions are indirect (electricity-related) emissions. The emissions intensity of Australian aluminium is more than twice the global average, due to the heavy reliance on coal-fired power. [15]

Here’s how beef production compares to aluminium and steel, based on: (i) carcass weight and standard 100-year GWP; (ii) retail weight and 100-year GWP; and (iii) retail weight and 20-year GWP. Beef’s figures vary by region. Those shown here are based on the global average.

Figure 1: Greenhouse Gas Emissions Intensity

Emissions-intensities-8

So, allowing for a 20-year GWP to more accurately reflect methane’s shorter-term impact, a kilogram of steak is 18 times as emissions intensive as a kilogram of Australian aluminium, and more than 30 times as emissions intensive as aluminium’s global average.

How do other foods compare?

The emissions intensity of the following foods have been reported to be less than 2 kg CO2-e per kg of product even (in respect of some) when transported overseas by boat: whole wheat; rice; carrots; potatoes; green beans; apples; oranges; and soy beans. [16] That is less than 0.7% of the top figure for beef from Figure 1. [Footnote 2]

MYTH 2: BUYING BEEF FROM LOCAL SOURCES IS ENVIRONMENTALLY-FRIENDLY

Why wouldn’t you believe this one, when the Australian Conservation Foundation says: “And be sure to support hardworking families in your community by buying from local farmers.”

Similarly, Bill McKibben has said that one of the most important measures for reducing the climate change impact of animal agriculture is to buy locally. He has said that when he’s at home, he tries to eat nothing produced outside the valley in which he lives.

But how effective is that approach in terms of beef?

The following image depicts the FAO’s breakdown of emissions from beef production (including beef from dairy cows), with “postfarm” emissions of 0.5 percent (including transport and processing) highlighted.

Figure 2: Breakdown of emissions from beef production (global average)

UNFAO-tackling-climate-change-through-livestock-Fig-7-highlighted

The main contributors are: enteric fermentation (which produces methane in a cow’s digestive system) 42.6%; manure-related emissions 23.1%; land use change through pasture expansion 14.8%; feed 10%; and fertilizer and crop residues 7.4%.

You can focus as much as you like on locally produced meat, but the relative positive impact is negligible.

Conclusion

Vested interest groups attempt to create the impression that beef and other animal products can be produced in an environmentally benign way. In reality, on the scale required to feed the masses, such products are unsustainable. A general shift towards a plant-based diet, along with a move away from fossil fuels, is essential if we are to overcome catastrophic climate change.

Footnotes:

1. I commented on Bill McKibben’s position in my articleDo the math: There are too many cows. [17] He appeared to be supporting a key proponent of intensive grazing systems, Allan Savory, on whom I commented in my article “Livestock and Climate: Why Allan Savory is not a saviour“. [18] Savory’s methods, even if successful in some situations, would never scale up to the level required.

2. Soy beans and other products grown on land that had been cleared of rain forest for that purpose would have a higher emissions intensity figure than indicated here, but still tiny compared to beef. In any event, if such products were only grown for human consumption, we would almost certainly not need to encroach on forested areas in that way. Most soy is grown as part of the grossly and inherently inefficient process of transferring plant-based nutrients to food animals for human consumption.

3. This article first appeared on the website rabble.ca on 15th April, 2014, with the title Why even grassfed and local beef isn’t sustainable. This is a slightly expanded version.

4. Postscript 9th May, 2014: The figures in Figure 1 are based on the global average percentage split of the various factors contributing to beef’s emissions intensity. As methane’s percentage contribution would be higher in grazing systems than in mixed systems, the “20-Year GWP” figures may be under-stated for the former and over-stated for the latter. They are intended to be approximations only.

5. Postscript 4th April, 2015: The retail figures attribute all carcass weight emissions to retail cuts of meat. If emissions are also attributed to other products that may be derived from the carcass, utilising fat, bone and the like, then the emissions intensity of the retail cuts will be around 28 percent lower than those shown here. For example, the maximum figure for grazed beef would be around 209, rather than 291 kg CO2-e/kg product.

Author: Paul Mahony

Related articles: Climate Change and Animal Agriculture

Images:

Cows grazing  © Ondrez | Dreamstime.com

Figure 2 adapted from Figure 7, p. 24, Food and Agriculture Organization of the United Nations, “Tackling climate change through livestock: A global assessment of  emissions and mitigation opportunities”, Nov 2013, http://www.fao.org/ag/againfo/resources/en/publications/tackling_climate_change/index.htm; http://www.fao.org/docrep/018/i3437e/i3437e.pdf

References:

[1] Australian Conservation Foundation, Green Home, “Eat less animal products”http://www2.acfonline.org.au/category/green-eating/tips/eat-less-animal-products (accessed 14 April, 2014)

[2] McKibben, Bill, “The only way to have a cow”, Orion Magazine, Mar/Apr 2010, http://www.orionmagazine.org/index.php/articles/article/5339/

[3] Eshel, G., “Grass-fed beef packs a punch to environment”, Reuters Environment Forum, 8 Apr 2010, http://blogs.reuters.com/environment/2010/04/08/grass-fed-beef-packs-a-punch-to-environment/

[4] Harper, L.A., Denmead, O.T., Freney, J.R., and Byers, F.M., Journal of Animal Science, June, 1999, “Direct measurements of methane emissions from grazing and feedlot cattle”, J ANIM SCI, 1999, 77:1392-1401, http://www.ncbi.nlm.nih.gov/pubmed/10375217; http://www.journalofanimalscience.org/content/77/6/1392.full.pdf

[5] Paterson, J., “CSIRO says cow methane emissions lower than first thought”, ABC Rural, 27 May, 2011, http://www.abc.net.au/site-archive/rural/news/content/201105/s3229224.htm

[6] Food and Agriculture Organization of the United Nations, “Tackling climate change through livestock: A global assessment of  emissions and mitigation opportunities”, Nov 2013, http://www.fao.org/ag/againfo/resources/en/publications/tackling_climate_change/index.htm; http://www.fao.org/docrep/018/i3437e/i3437e.pdf

[7] Food and Agriculture Organization of the United Nations, “Greenhouse gas emissions from ruminant supply chains: A global life cycle assessment”, Nov 2013, http://www.fao.org/ag/againfo/resources/en/publications/tackling_climate_change/index.htm; http://www.fao.org/docrep/018/i3461e/i3461e.pdf

[8] United States Department of Agriculture Economic Research Service, Agricultural Handbook No. 697, June, 1992 (website updated 10 September, 2013), “Weights, Measures, and Conversion Factors for Agricultural Commodities and Their Products”,  http://www.ers.usda.gov/publications/ah-agricultural-handbook/ah697.aspx#.U0ihR6Ikykw

[9] Intergovernmental Panel on Climate Change, Fifth Assessment Report, 2014, http://www.ipcc.ch/report/ar5/

[10] Shindell, D.T., Faluvegi, G., Koch, D.M., Schmidt, G.A., Unger, N., Bauer, S.E., Improved Attribution of Climate Forcing to Emissions“, Science 30 October 2009: Vol. 326 no. 5953 pp. 716-718 DOI: 10.1126/science.1174760, https://www.sciencemag.org/content/326/5953/716.figures-only

[11] Intergovernmental Panel on Climate Change, Fifth Assessment Report, 2014, http://www.ipcc.ch/report/ar5/, cited in Romm, J., “More Bad News For Fracking: IPCC Warns Methane Traps More Heat”, The Energy Collective, 7th October, 2013, http://theenergycollective.com/josephromm/284336/more-bad-news-fracking-ipcc-warns-methane-traps-much-more-heat-we-thought

[12] Hamilton, C, “Scorcher: The Dirty Politics of Climate Change”, (2007) Black Inc Agenda, p. 40

[13] George Wilkenfeld & Associates Pty Ltd and Energy Strategies, “National Greenhouse Gas Inventory 1990, 1995, 1999, End Use Allocation of Emissions Report to the Australian Greenhouse Office, 2003, Volume 1”, Table S5, p. vii

[14] Australian Aluminium Council Ltd, “Climate Change: Aluminium Smelting Greenhouse Performance”, http://aluminium.org.au/climate-change/smelting-greenhouse-performance (Accessed 14th April, 2014)

[15] Turton, H. “Greenhouse gas emissions in industrialised countries Where does Australiastand?”, The Australia Institute, Discussion Paper Number 66, June 2004, ISSN 1322-5421, p. viii, https://www.tai.org.au/documents/dp_fulltext/DP66.pdf

[16] Carlsson-Kanyama, A. & Gonzalez, A.D. “Potential Contributions of Food Consumption Patterns to Climate Change”, The American Journal of Clinical Nutrition, Vol. 89, No. 5, pp. 1704S-1709S, May 2009, http://www.ajcn.org/cgi/content/abstract/89/5/1704S

[17] Mahony, P., “Do the math: There are too many cows”, 26 July, 2013, https://terrastendo.net/2013/07/26/do-the-math-there-are-too-many-cows/

[18] Mahony, P., “Livestock and Climate: Why Allan Savory is not a saviour“, 26 March, 2013, https://terrastendo.net/2013/03/26/livestock-and-climate-why-allan-savory-is-not-a-saviour/